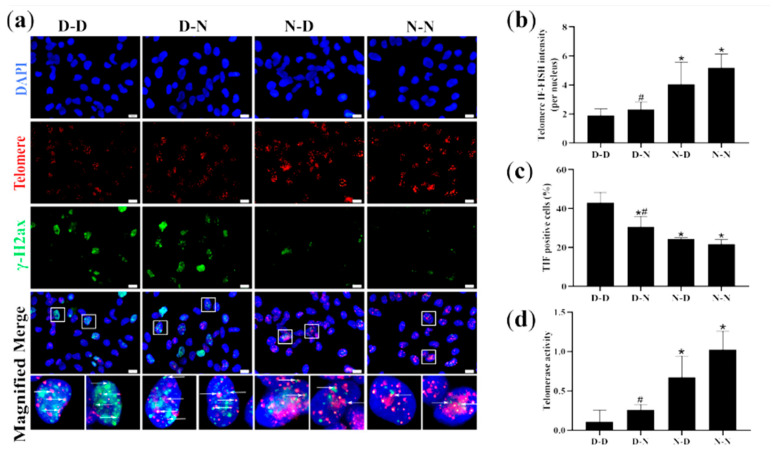
Figure 7.
Telomere length, telomeric DNA damage, and telomerase activity of NSCs in vitro. Offspring were grouped as described in Figure 1, and NSCs were cultured as described in Figure 3. (a) Representative micrographs of Immunofuorescence-Fluorescent In Situ Hybridization (IF-FISH) of NSCs in vitro, in which NSCs are stained with anti-phospho-histone H2AX (γ-H2AX) (green), telomere (red) and DAPI (blue). Scale bar = 10 μm. Each below merge column depicts a magnified image of the rectangular region of its corresponding image in the upper merge column Scale bar = 10 μm. (b) Telomere length quantified by IF-FISH in NSCs in vitro. (c) Percentages of telomere dysfunction-induced foci (TIF) cells (containing both C-rich telomere probe-FITC (TelC-FITC) and γ-H2AX) of NSCs in vitro. (d) Telomerase activity of NSCs in vitro. Data are expressed as mean ± SD (n = 5 for each group). *: p < 0.05 compared with D-D group. #: p < 0.05 compared with N-N group.

