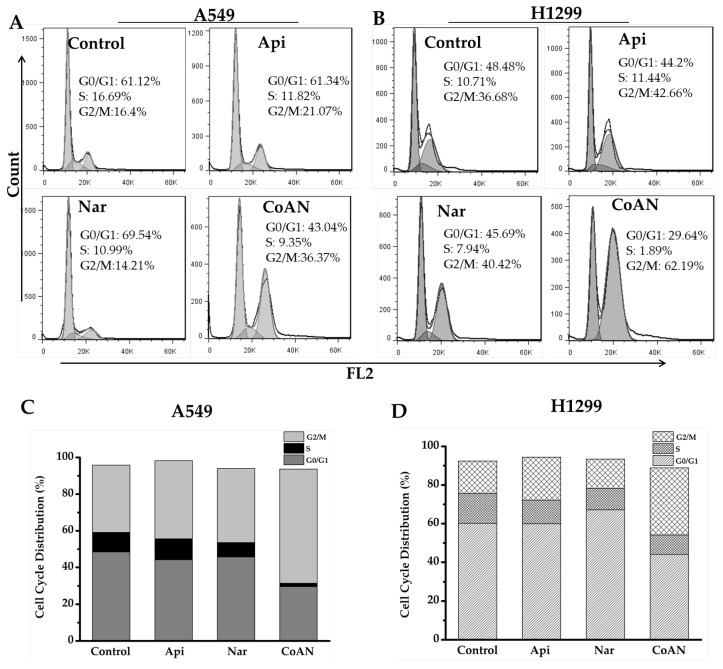
Figure 3.
The cell cycle analysis of the A549 and H1299 cells after 28.7 μM and 32.5 μM of Api, Nar, or both (CoAN) treatments for 24 h, respectively. (A,B) are representative diagrams of the cell cycle phases. (C,D) are the statistical data of the cell cycle phase distributions in A549 and H1299 cells.

