Fig. 1.
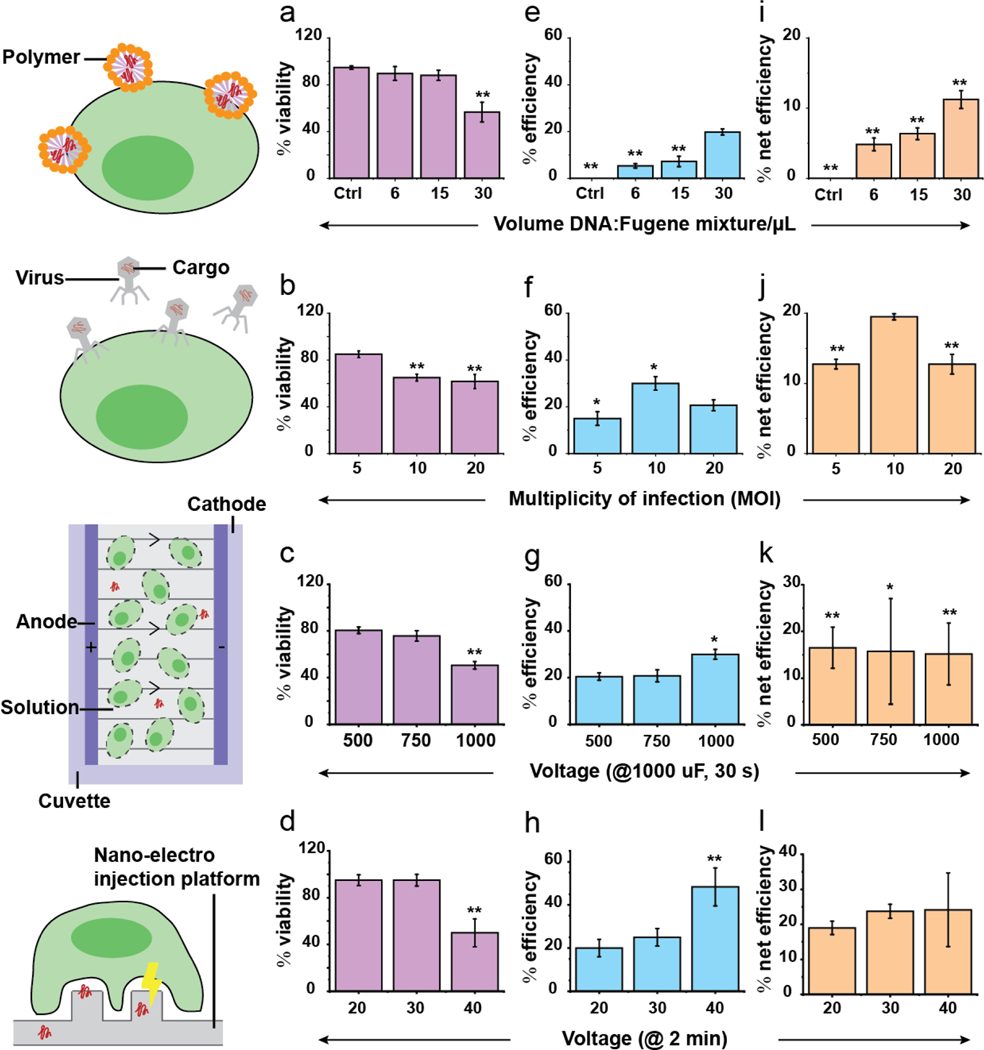
Cell viability, transfection efficiency, and net efficiencies for different transfection techniques. (a-b) Cell viability was calculated as the percentage of cells that were not stained by propidium iodide, a dye impermeable to live cells, 24 hr after transfection. Generally, higher multiplicity of infection (MOI) i.e. viral particles per cell, concentration of polymer-DNA mixtures and voltages reduced cell viability. (e-h) Transfection efficiency was calculated as the percentage of fluorescent cells 24 hr after transfection. Higher MOI, concentration of polymer-DNA mixtures and voltages boosted transfection efficiencies. (i-l) Net transfection efficiency was calculated as the product of cell viability and transfection efficiency. This parameter illustrates the trade-off between cell viability and transfection efficiency. The results showed that comparable net transfection efficiencies (11–24%) were obtained using different techniques. Error bars shown are ± standard deviations. *: p < 0.05, **: p < 0.001 (statistics were performed relative to NEI, 30 V which provided the highest net transfection efficiency. There were 0.2*106 cells in each transfection condition.).

