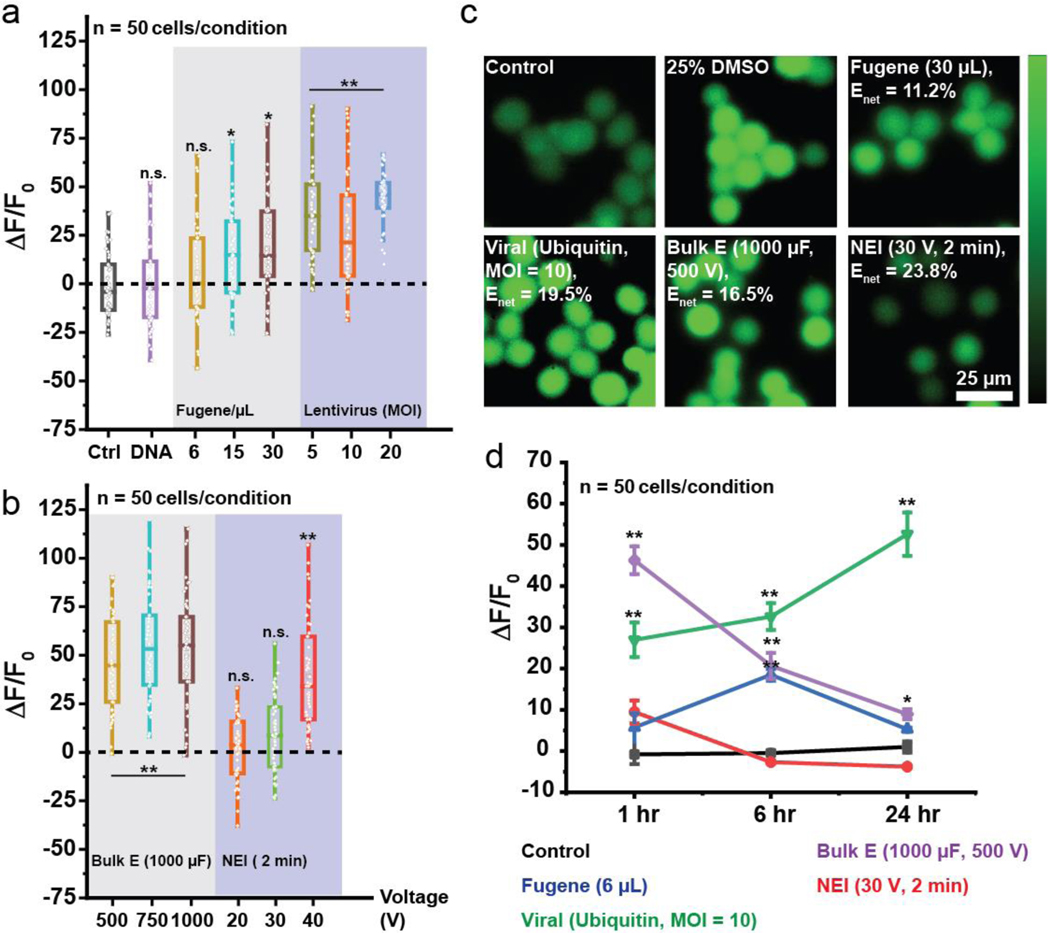
Fig. 2.
Monitoring calcium stresses due to transfection. (a-b) Intracellular Ca2+ fluorescence levels (ΔF/F0) monitored 1 hr after transfection. Higher MOI, concentrations of DNA-polymer mixtures and voltages generally led to greater Ca2+ levels, indicative of higher stress. Low concentration of Fugene-DNA mixture (6 μL) and NEI at 20/30 V) did not significantly cause Ca2+ influx unlike viruses and bulk electroporation. (c) Ca2+ fluorescence images showing high intracellular Ca2+ after transfection with Fugene (30 μL), virus (Ubiquitin promoter, MOI = 10) and bulk electroporation (1000 μF, 1000 V) while NEI (30 V, 2 min) had Ca2+ fluorescence levels similar to control despite achieving similar net transfection efficiencies as the other methods. Enet: Net transfection efficiency. (d) Ca2+ fluorescence levels were monitored at the 1/6/24 hr time points. Although Fugene (6 μL) led to minimal Ca2+ influx 1 hr post-transfection, intracellular Ca2+ fluorescence levels continued to rise until the 6 hr time-point before declining at the 24 hr time-point. On the other hand, NEI led to minimal increase in intracellular Ca2+ fluorescence levels acutely (1 hr) and chronically (> 1 hr). This trend was the opposite with viruses which led to increasing intracellular Ca2+ fluorescence levels even 24 hr post-transfection. n.s.: not significant, *: p < 0.05, **: p < 0.001, with 50 cells analyzed in each condition. Error bars shown are ± standard mean error.

