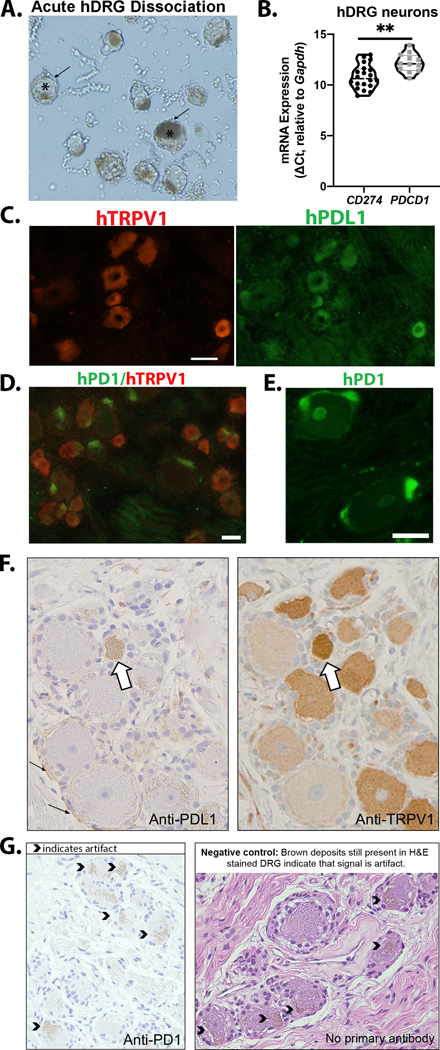
Figure 4. Expression of PDL1 and PD1 in human DRG neurons.
(A) Brightfield image of acutely dissociated human DRG (10X) used for collection of neurons for mRNA analysis. * marks examples of neurons surrounded by satellite glia (arrow). (B) CD274 and PDCD1 mRNA was detectable in human DRG neurons (n=24, N=3); CD274 mRNA was significantly higher (lower ΔCt) compared to PDCD1 mRNA, t(30)=3.412, p=0.002 (Student’s t test). (C) Representative micrographs of a human DRG section labeled to detect TRPV1, de-glycosylated and subsequently labeled for PDL1. (D) Representative micrograph of human DRG co-labeled with antibodies to TRPV1 and PD1 (Biolegend). (E) High magnification (20X) image of human DRG labeled with anti-PD1 (Sigma) indicates expression in nonneuronal cells. Micrographs are representative of independent experiments performed on DRG from a minimum of 4 donors (Supplementary Table 1). (F) Adjacent sections of human DRG stained for PDL1 and TRPV1. White arrow indicates a neuron with expression of both PDL1 and TRPV1. Small black arrows indicate nonneuronal expression of PDL1. (G) PD1 immunoreactivity in human DRG was not detected via IHC. The caret symbols indicate brown signal that was determined to be artifact because it was also present in the negative controls (tissue sections in which primary antibody was excluded during the staining process). Detailed antibody information is provided in Supplementary Table 3 and 4. All scale bars=50μm.

