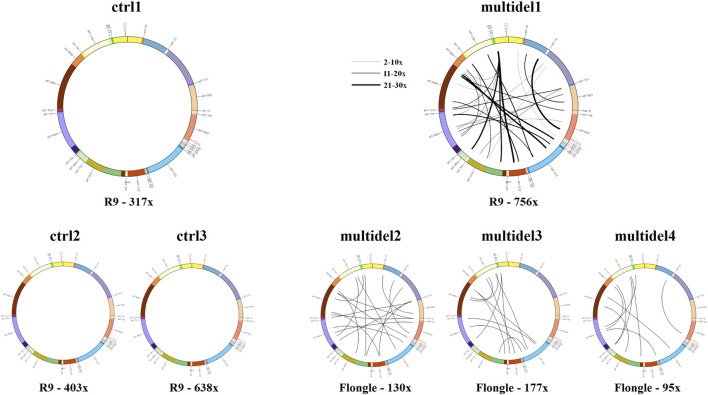
FIGURE 4.
Circos plot visualization using Circos plots for control samples (ctrl1, ctrl2, and ctrl3) and samples carrying multiple mtDNA deletions (multidel1, multidel2, multidel3, and multidel4) sequenced using the Rapid kit. Black lines indicate the deletions and link the coordinates of deletion breakpoints. For sample multidel1 (sequenced on the Flow Cell R.9.4.1), lines thickness is proportional to the number of reads containing the deletion. Under each graph, flow cell type and average depth of coverage are indicated (R9 = Flow cell R9.4.1).

