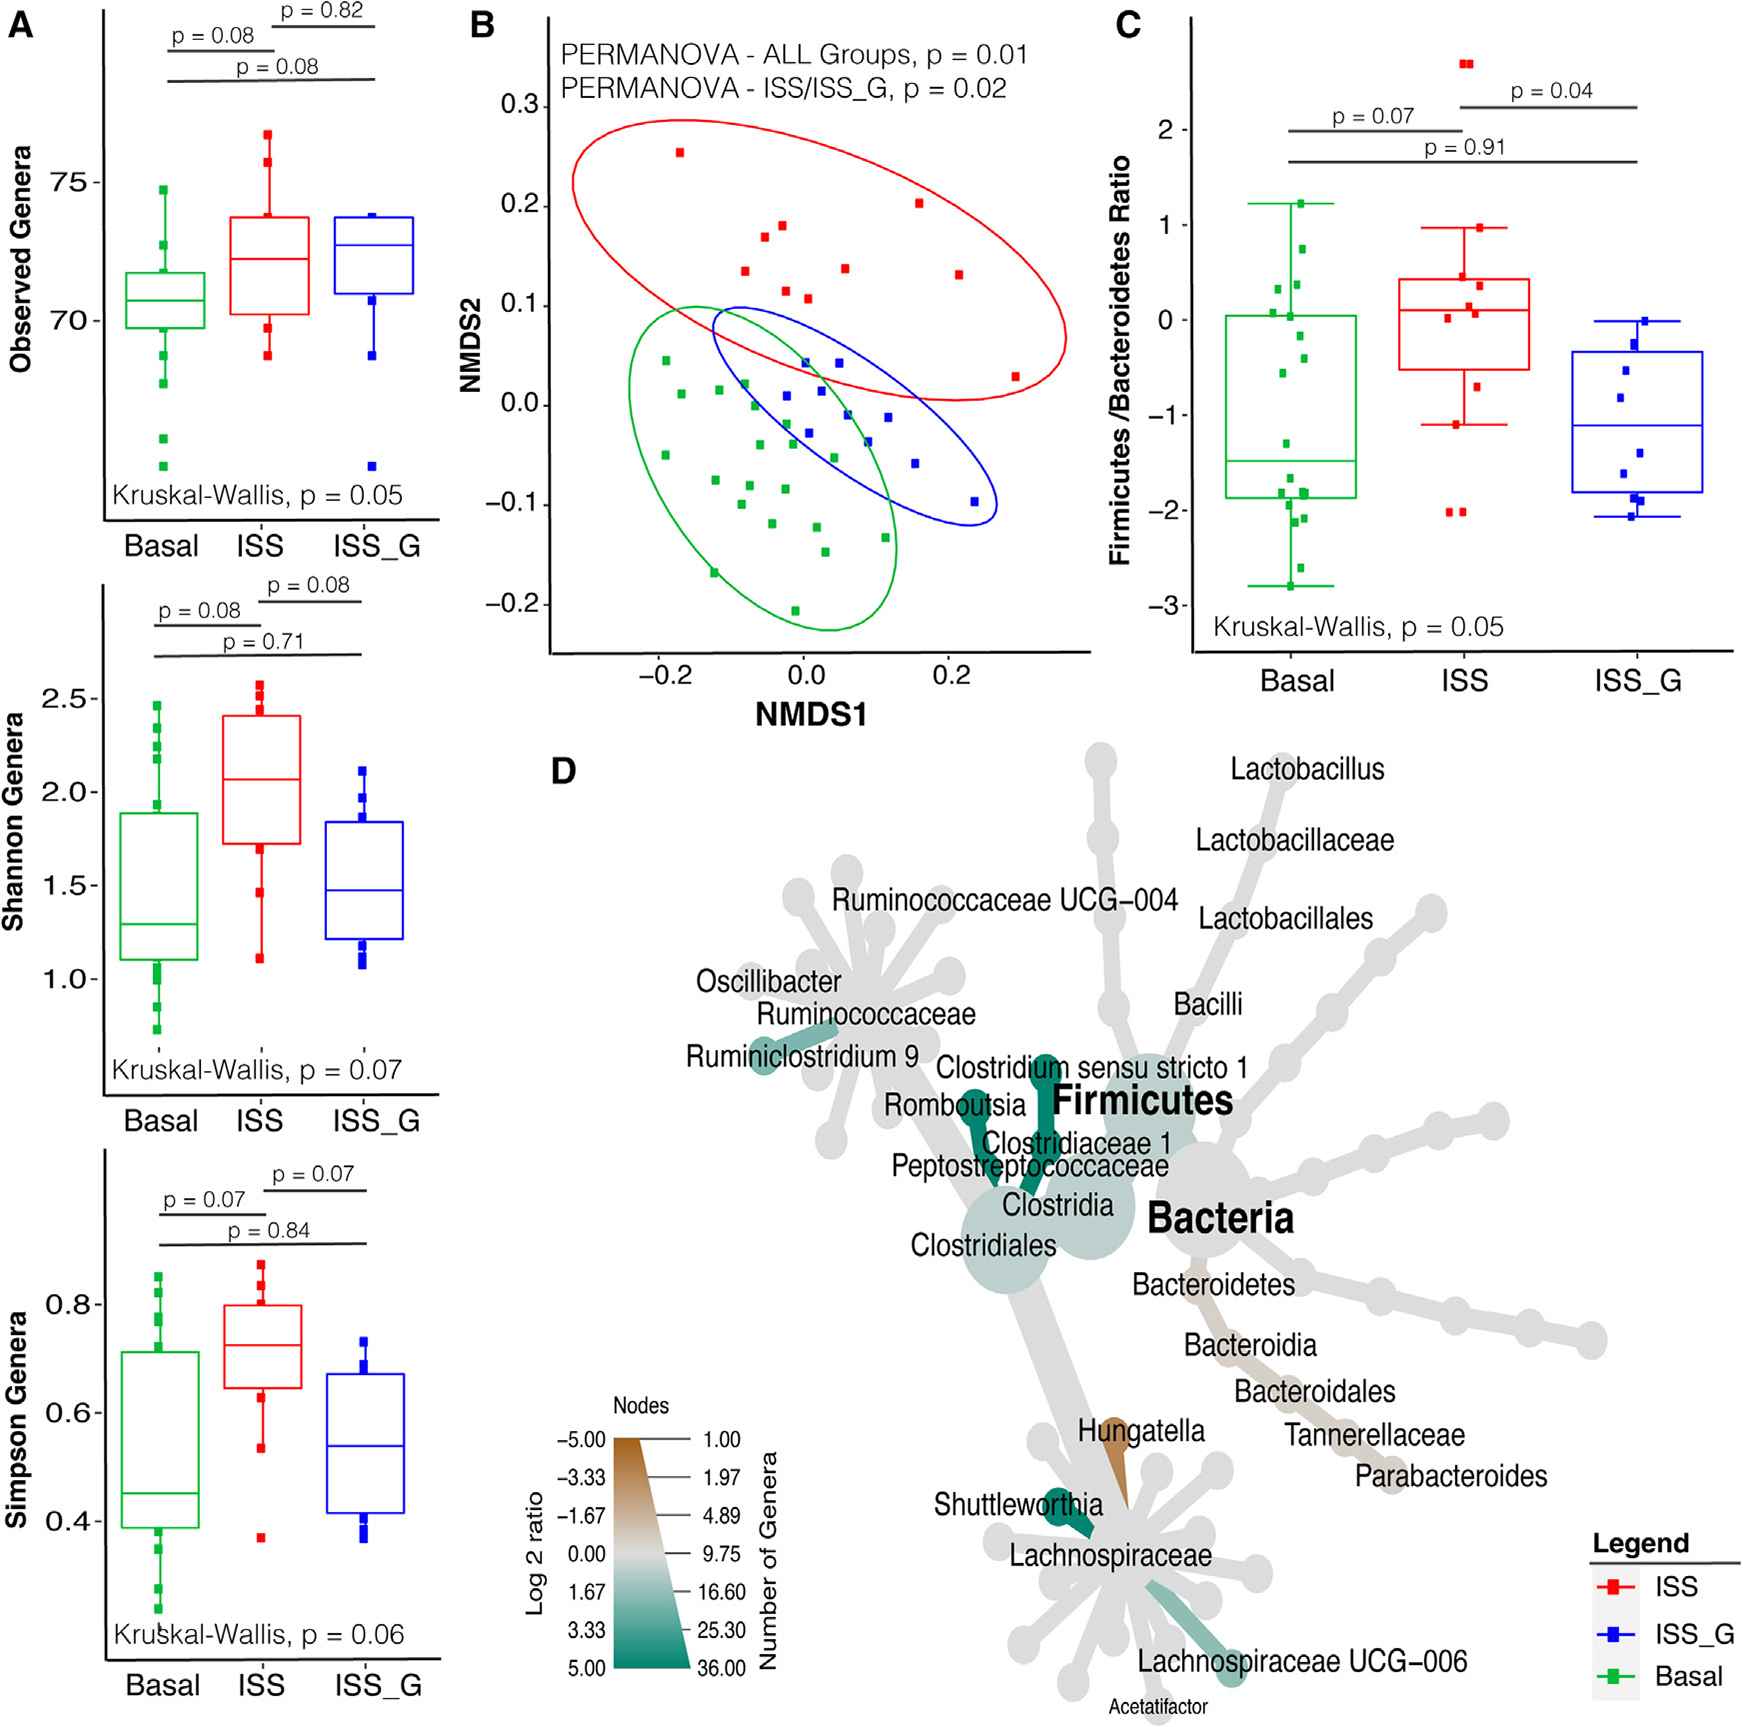
Figure 2. Alpha diversity, beta diversity, and comparative compositional shift analysis of the fecal microbiome (from necropsy) in the ISS flight cohort versus the ISS_G ground control cohort.

(A) Alpha diversity analysis of observed genera, Shannon, and Simpson diversity indices comparing ISS versus ISS_G or basal cohorts (week 9). The non-parametric Kruskal-Wallis statistical test was used to compare groups of two or more. The Wilcoxon rank-sum statistical test was employed for pairwise comparisons, and statistical significance is indicated accordingly.
(B) Beta diversity analysis comparing the ISS with the ISS_G or basal cohorts (week 9). Non-parametric multivariate analysis of variance (PERMANOVA) was used to calculate a statistical comparison of all cohorts or pairwise using distance matrices. Statistical significance is indicated accordingly.
(C) Comparative analysis of Firmicutes-to-Bacteroidetes ratios between the ISS and the ISS_G or basal cohorts (week 9). The non-parametric Kruskal-Wallis statistical test was used to compare groups of two or more. The Wilcoxon rank-sum statistical test was employed for all pairwise comparisons of alpha diversity. Statistical significance is indicated accordingly.
(D) Comparative analysis of genera enriched or lost in the ISS compared with the ISS_G control cohort (week 9). Taxa enriched or lost in the ISS cohort at a threshold of p < 0.05 compared with taxa present in the ISS_G cohort are represented in the MetacodeR heat tree by a color intensity log2 median ratio scale. The Wilcoxon rank-sum statistical test was used, and p values are indicated in the text.
