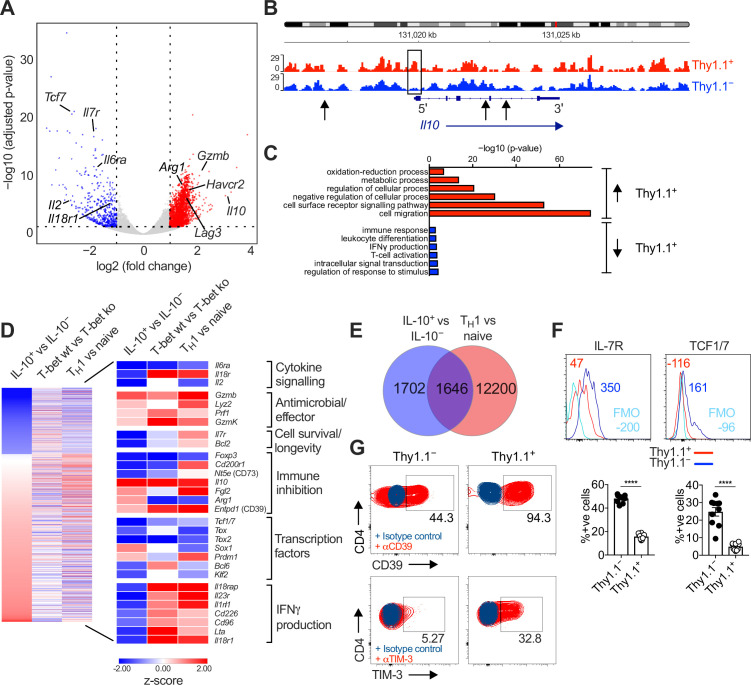
Figure 1. Interleukin (IL)-10-producing CD4+ T cells display a TH1-like profile.
10BiT mice were infected with 3 × 10⁴ pfu of murine cytomegalovirus (MCMV). Leukocytes were isolated from the salivary glands (SGs) on day 14 p.i. and sorted as CD4+ CD44+ CD62L− CD90/90.1+ (Thy1.1+) or CD90/90.1− (Thy1.1−) populations via fluorescence-activated cell sorting (FACS). (A) Volcano plot highlighting differentially upregulated genes in Thy1.1+ CD4+ T cells (red) versus Thy1.1− CD4+ T cells (blue). (B) ATAC-seq profiles showing accessible chromatin regions in the Il10 gene for Thy1.1+ CD4+ T cells (red) and Thy1.1− CD4+ T cells (blue). Data are shown as normalized values accounting for the total number of reads per lane. The black box indicates a major difference in chromatin accessibility. Black arrows indicate binding motifs for Tbx21. (C) Gene ontology analysis of data from (A) indicating the top six modules that were upregulated (red) or downregulated (blue) in Thy1.1+ CD4+ T cells. (D) Heatmap comparing data from (A) (left column) with published data from T-bet+ versus T-bet-knockout CD4+ T cells (middle column, GSE38808) and TH1 versus naive CD4+ T cells (right column, E-MTAB-2582). Displayed genes were selected according to relevant pathways identified via gene ontology analysis and tabulated against respective functions (all p < 0.05). (E) Venn diagram showing the overlap between genes enriched in Thy1.1+ CD4+ T cells (A, D) and genes enriched in TH1-like CD4+ T cells (E-MTAB-2582). Data in (A–E) are shown as pooled analyses from a minimum of n = 5 mice per group representing three independent experiments. (F) Representative histograms (top) and summary bar graphs (bottom) showing the expression of IL-7R and TCF1/7 among Thy1.1+ CD4+ T cells (red) and Thy1.1− CD4+ T cells (blue). The fluorescence-minus-one control is shown in sky blue (top). Bottom: data are shown as mean ± standard error of the mean (SEM; n = 10 mice per group representing two independent experiments). ****p < 0.0001 (Mann–Whitney U test). (G) Representative flow cytometry plots showing the expression of CD39 and TIM-3 among Thy1.1+ CD4+ T cells (red) and Thy1.1− CD4+ T cells (blue). Data are shown as pooled analyses from a minimum of n = 10 mice per group representing two independent experiments.


