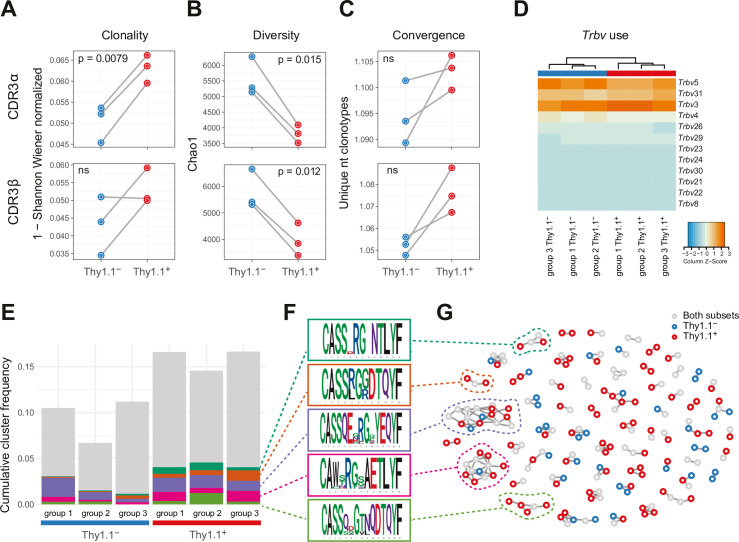
Figure 2. Interleukin (IL)-10-producing CD4+ T cells exhibit prominent clonal structures.
10BiT mice were infected with 3 × 10⁴ pfu of murine cytomegalovirus (MCMV). Leukocytes were isolated from the salivary glands (SGs) on day 14 p.i. and sorted as CD4+ CD44+ CD62L− CD90/90.1+ (Thy1.1+) or CD90/90.1− (Thy1.1−) populations via fluorescence-activated cell sorting (FACS). (A) Clonality and (B) diversity metrics calculated for the T cell receptor (TCR)α (top) and TCRβ repertoires (bottom) derived from Thy1.1+ CD4+ T cells and Thy1.1− CD4+ T cells. (C) TCR convergence measured as the average number of nucleotide sequences encoding amino acid-identical complementarity-determining region (CDR)3α (top) and CDR3β loops (bottom) across the 2000 most prevalent clonotypes. (A–C) p values were calculated using a paired t-test with Benjamini–Hochberg correction. ns, not significant. (D) Hierarchical clustering of Trbv gene use weighted by clonotype frequency. (E–G) Cluster analysis of the 500 most prevalent TCRβ clonotypes using the tcrgrapher pipeline. (E) The cumulative frequency of tcrgrapher hits per sample is shown in gray. The frequency of each cluster comprising at least two tcrgrapher hits was calculated for each sample and averaged across all six repertoires. The five most prevalent clusters are shown in color. (F) Amino acid logos for each of the five most prevalent clusters. (G) Visual representation of clusters comprising at least two tcrgrapher hits. Nodes represent unique amino acid sequences. Edges connect sequences with a single amino acid mismatch. Amino acid sequences present only in Thy1.1+ CD4+ T cells are shown in red, amino acid sequences present only in Thy1.1− CD4+ T cells are shown in blue, and amino acid sequences present in both Thy1.1+ CD4+ T cells and Thy1.1− CD4+ T cells are shown in gray. Data are shown as pooled analyses from n = 4 mice per group representing three independent experiments (groups 1–3).


