. 2023 Jul 13;12:e79165. doi: 10.7554/eLife.79165

Figure 5. Interleukin (IL)-10-producing CD4+ T cells express T-bet and T-bet-inducible genes.

(A, B) 10BiT mice were infected with 3 × 10⁴ pfu of murine cytomegalovirus (MCMV). (A) Leukocytes were isolated from the salivary glands (SGs) on day 14 p.i. Representative histograms (left) and summary bar graph (right) show the expression of T-bet among Thy1.1+ CD4+ T cells (red) and Thy1.1 CD4+ T cells (blue). Data are shown as mean ± standard error of the mean (SEM; n = 5–6 mice per group pooled from two independent experiments). MFI, median fluorescence intensity. **p < 0.01 (Mann–Whitney U test). (B) Leukocytes were isolated from the SGs on day 14 p.i. and sorted as CD4+ CD44+ CD62L CD90/90.1+ (Thy1.1+) or CD90/90.1 (Thy1.1) populations via fluorescence-activated cell sorting (FACS). ATAC-seq profiles show accessible chromatin regions in the Tbx21 gene for Thy1.1+ CD4+ T cells (red) and Thy1.1 CD4+ T cells (blue). Data are shown as normalized values accounting for the total number of reads per lane. The black boxes indicate major differences in chromatin accessibility. Data are shown as pooled analyses from a minimum of n = 5 mice per group representing three independent experiments. (C) Venn diagram showing the overlap between genes enriched in Thy1.1+ CD4+ T cells (A, D) and genes enriched in T-bet+ CD4+ T cells (GSE38808). (D) Cd4+/+Tbx21flox/flox (Cd4+/+) and Cd4CreERT2/+Tbx21flox/flox (Cd4Cre/+) mice were infected with 3 × 10⁴ pfu of MCMV. Tamoxifen was administered (+Tam) or withheld (−Tam) from days 7 to 12 p.i. Leukocytes were isolated from the SGs on day 14 p.i. Representative flow cytometry plots show the expression of CD4 versus RFP (left) and CD44 versus T-bet for the gated populations (right). Data in the bar graph are shown as mean ± SEM (n = 4–5 mice per group representing four or five independent experiments). *p < 0.05, **p < 0.01 (Mann–Whitney U test).

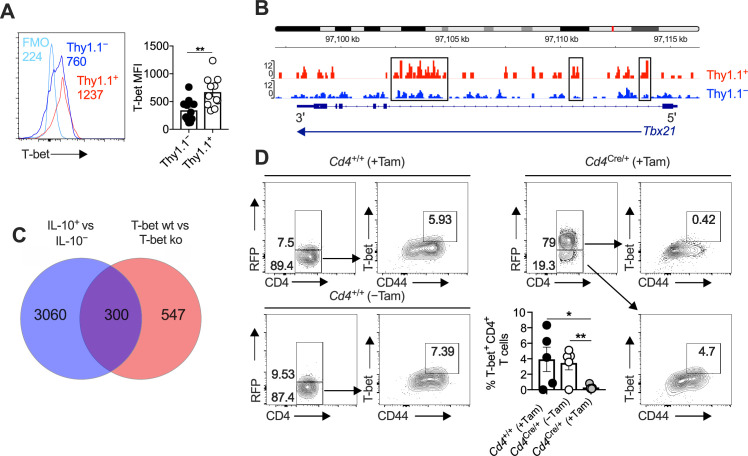
Figure 5—source data 1. Interleukin (IL)-10-producing CD4+ T cells express T-bet and T-bet-inducible genes.
Source data Figure 5A: expression of T-bet (median fluorescence intensity, MFI) among Thy1.1+ CD4+ T cells and Thy1.1 CD4+ T cells isolated from the salivary glands (SGs) on day 14 p.i. measured via flow cytometry (10BiT mice). Source data Figure 5D: percent expression of CD4 versus T-bet among leukocytes isolated from the SGs on day 14 p.i. (Cd4+/+Tbx21flox/flox and Cd4CreERT2/+Tbx21flox/flox mice).

Figure 5.

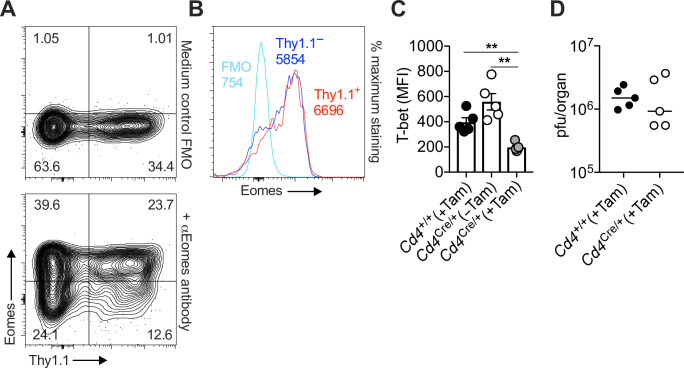
Figure 5—figure supplement 1. Interleukin (IL)-10-producing CD4+ T cells are not selectively regulated by Eomes.

Figure 5—figure supplement 1.

Representative flow cytometry plots (A) and histograms (B) showing the expression of Eomes versus Thy1.1. (C, D) Cd4+/+Tbx21flox/flox and Cd4CreERT2/+Tbx21flox/flox mice were infected with 3 × 10⁴ pfu of murine cytomegalovirus (MCMV). Tamoxifen was administered (+Tam) or withheld (−Tam) from days 7 to 12 p.i. (C) Leukocytes were isolated from the salivary glands (SGs) on day 14 p.i. The expression of T-bet was measured via flow cytometry. Data are shown as mean ± standard error of the mean (SEM; n = 4–5 mice per group representing four or five independent experiments). MFI, median fluorescence intensity. **p < 0.01 (Mann–Whitney U test). (D) MCMV replication in SG homogenates on day 28 p.i. measured via plaque assay. Data are shown as individual points with median values (n = 5 mice per group representing three independent experiments).
Figure 5—figure supplement 1—source data 1. Interleukin (IL)-10-producing CD4+ T cells are not selectively regulated by Eomes.
Source data Figure 5—figure supplement 1C: expression of T-bet (median fluorescence intensity, MFI) among CD4+ T cells isolated from the salivary glands (SGs) on day 14 p.i. measured vi flow cytometry (Cd4+/+Tbx21flox/flox and Cd4CreERT2/+Tbx21flox/flox mice). Source data Figure 5—figure supplement 1D: murine cytomegalovirus (MCMV) replication in SG homogenates (pfu/organ) on day 28 p.i. measured via plaque assay (Cd4+/+Tbx21flox/flox and Cd4CreERT2/+Tbx21flox/flox mice).