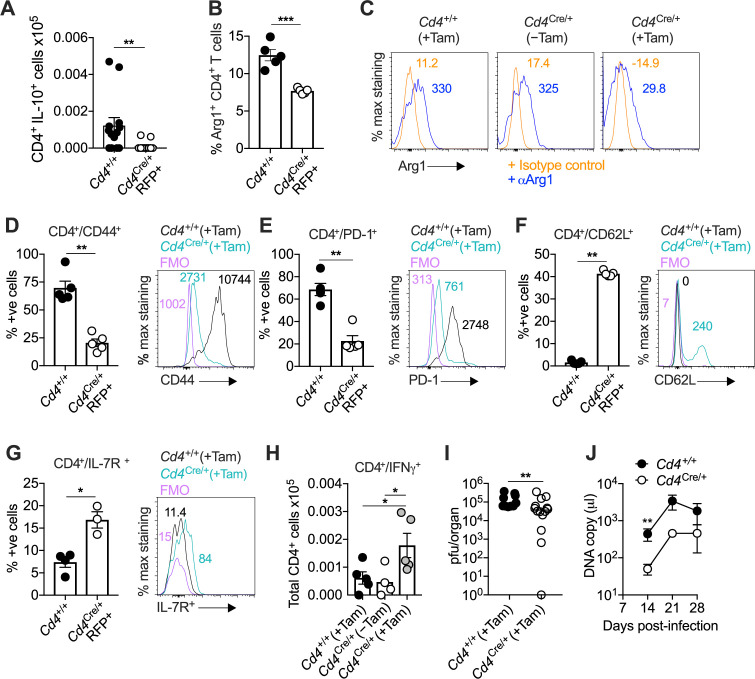
Figure 6. Interleukin (IL)-10-producing CD4+ T cells develop in a T-bet-dependent manner.
(A–J) Cd4+/+Tbx21flox/flox (Cd4+/+) and Cd4CreERT2/+Tbx21flox/flox (Cd4Cre/+) mice were infected with 3 × 10⁴ pfu of murine cytomegalovirus (MCMV). Tamoxifen was administered (+Tam) or withheld (−Tam) from days 7 to 12 p.i. Leukocytes were isolated from the salivary glands (SGs) on day 14 p.i. (A) MCMV-specific CD4+ T cell responses in the SGs measured using flow cytometry to detect IL-10. Immunodominant peptides were pooled for stimulation. Data are shown as mean ± standard error of the mean (SEM; n = 4–5 mice per group representing two independent experiments). **p < 0.01 (Mann–Whitney U test). Summary bar graph (B) and representative histograms (C) showing the expression of arginase-1 (Arg1) among CD4+ T cells measured via flow cytometry. Data are shown as mean ± SEM (n = 5 mice per group representing two independent experiments). ***p < 0.001 (Mann–Whitney U test). Summary bar graphs (left) and representative histograms (right) showing the expression of CD44 (D), PD-1 (E), CD62L (F), and IL-7R (G) among CD4+ T cells measured via flow cytometry. Data in (D–F) are shown as mean ± SEM (n = 5 mice per group representing two independent experiments). Data in (G) are shown as mean ± SEM (n = 3–4 mice per group representing two independent experiments). *p < 0.05, **p < 0.01 (Mann–Whitney U test). (H) MCMV-specific CD4+ T cell responses in the SGs measured using flow cytometry to detect interferon (IFN)γ. Immunodominant peptides were pooled for stimulation. Data are shown as mean ± SEM (n = 4–5 mice per group representing two independent experiments). *p < 0.05 (Mann–Whitney U test). (I) MCMV replication in SG homogenates on day 14 p.i. measured via plaque assay. Data are shown as individual points with median values (n = 10–14 mice per group pooled from three independent experiments). **p < 0.01 (Mann–Whitney U test). (J) Viral genomes in saliva on days 7, 14, 21, and 28 p.i. measured via qPCR. Data are shown as mean ± SEM (n = 5 mice per group representing two independent experiments). **p < 0.01 (Mann–Whitney U test). Data in (A–I) show all groups after the administration of tamoxifen.

