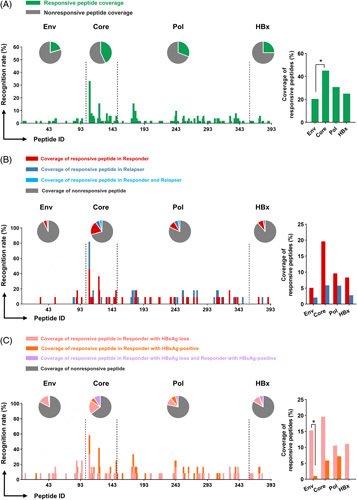
FIGURE 2.

Analyzing the breadth of HBV-specific T-cell responses in patients with different outcomes after therapy withdrawal. A total of 393 single peptides were tested by T-cell ELISpot. The recognition rate was calculated as the number of patients who were responsive to one single peptide relative to all detected patients. The coverage of responsive peptides was the number of single responsive peptides divided by the number of corresponding peptides pool, including Env (98), Core (51), Pol (208), and HBx (36). (A) The recognition rate and the coverage of responsive peptides in all patients (n=51). The coverage of responsive peptides in (B) sex-matched and age-matched responders (n=11) and relapsers (n=11), or (C) HBsAg loss (n=12) and HBsAg-positive (n=12) responders at 96 weeks after therapy withdrawal. The number of patients with specific single responsive or nonresponsive peptides was noted in the bar. (A–C) Chi square test or Fisher test. *p < 0.05. Abbreviations: Env, Envelope; Pol, Polymerase.
