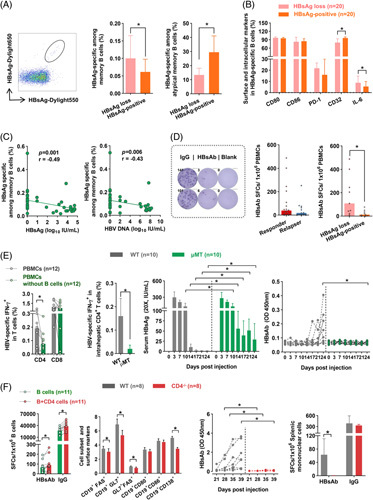
FIGURE 5.

CD4+ T-cell-involved humoral immune response favors HBsAg loss. (A) Representative plots of HBsAg-specific B cells. The frequency of (A) HBsAg-specific memory B cells and atypical memory B cells, (B) surface markers and IL-6 of HBsAg-specific B cells in HBsAg loss (n=20) and HBsAg-positive (n=20) patients (n=20). (C) Spearman correlation analysis of HBsAg-specific memory B cells with HBsAg or HBV DNA levels (n=40). (D) Representative plots of B cell ELISpot assays. HBsAb-producing B cells in responders (n=18) and relapsers (n=13) or HBsAg loss (n=9) and HBsAg-positive patients (n=9) at 96 weeks of discontinuation. (E, left panel) Bulk PBMCs or B cell-depleted PBMCs were stimulated with HBV peptides for 10 days; subsequently, IFN-γ-producing HBV-specific T cells in CD4+ and CD8+ T cells were assessed. (E, right panel) WT and μMT mice were injected with pAAV-HBV1.2 HDI. HBV-specific IFN-γ+ intrahepatic CD4+ T cells in WT and μMT mice were detected. Dynamic changes in concentrations of HBsAg (20×, IU/mL) and the OD values of HBsAb in WT and μMT mice were measured. (F, left panel) B cells were cocultured with or without CD4+ T cells, and HBsAb-producing and IgG-producing cells were detected by ELISpot. (F, right panel) WT and CD4-/- mice were injected with pAAV-HBV1.2 HDI. The activation markers (FAS, GL7, CD80, and CD86) of B cells, GC (FAS+GL7+), plasma cells (CD19+CD138+), and the OD values of HBsAb were measured. HBsAb-producing and IgG-producing splenic mononuclear cells were detected by ELISpot. (A–F) Mann–Whitney U test or paired Wilcoxon test. *p < 0.05. Abbreviations: HDI, hydrodynamic injection; OD, optical density; PBMCs, peripheral blood mononuclear cells; SFCs, spot-forming cells; WT, wild type.
