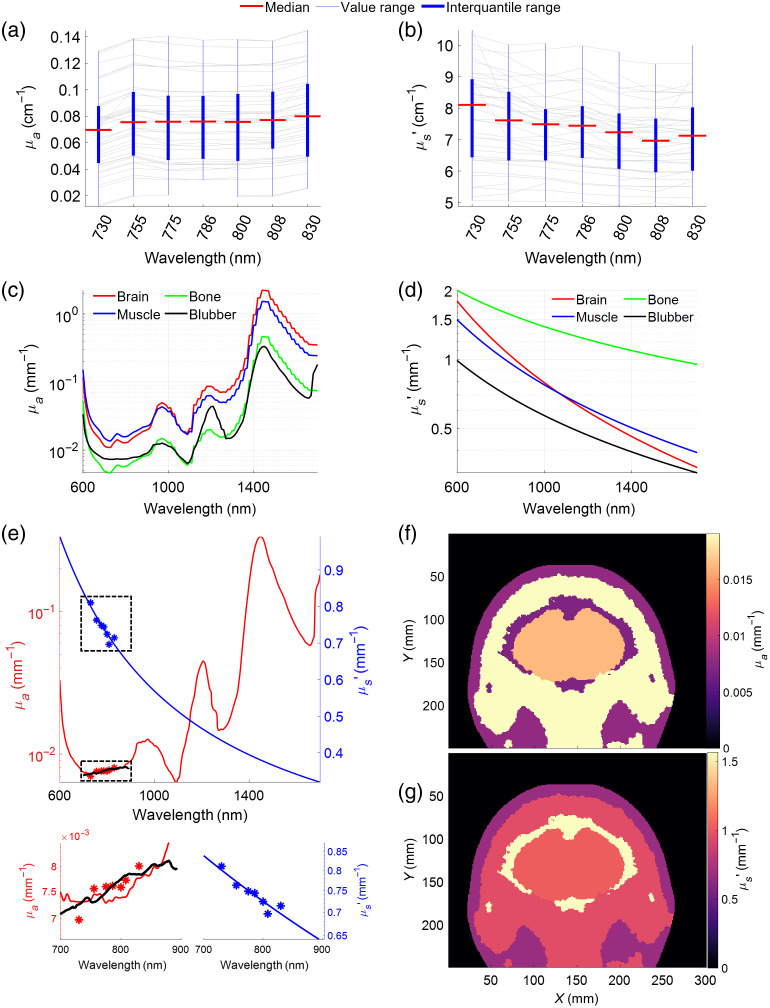
Fig. 2.
Optical properties taken from the literature and measured from bottlenose dolphins. (a) Measured absorption coefficient . (b) Reduced scattering coefficient . The gray lines show artifact-free measurements included in the analysis; red lines indicate the median after outlier rejection based on a maximum distance of 1.5 interquartile range from the median. (c) Absorption coefficient for brain, muscle, bone, and blubber tissue as assigned to the model. (d) Scattering coefficients assigned to all tissues in the model. (e) Results from fitting the absorption coefficients [graphs (a) and (b)] to the measured data (asterisks) to derive (red) and (blue). The black line shows the fitted absorbance from the broadband photo-spectrometer. Dashed boxes are enlarged below for a wavelengths range of 700 to 900 nm. (f), (g) A cross-section of the dolphin with optical properties at 850 nm.

