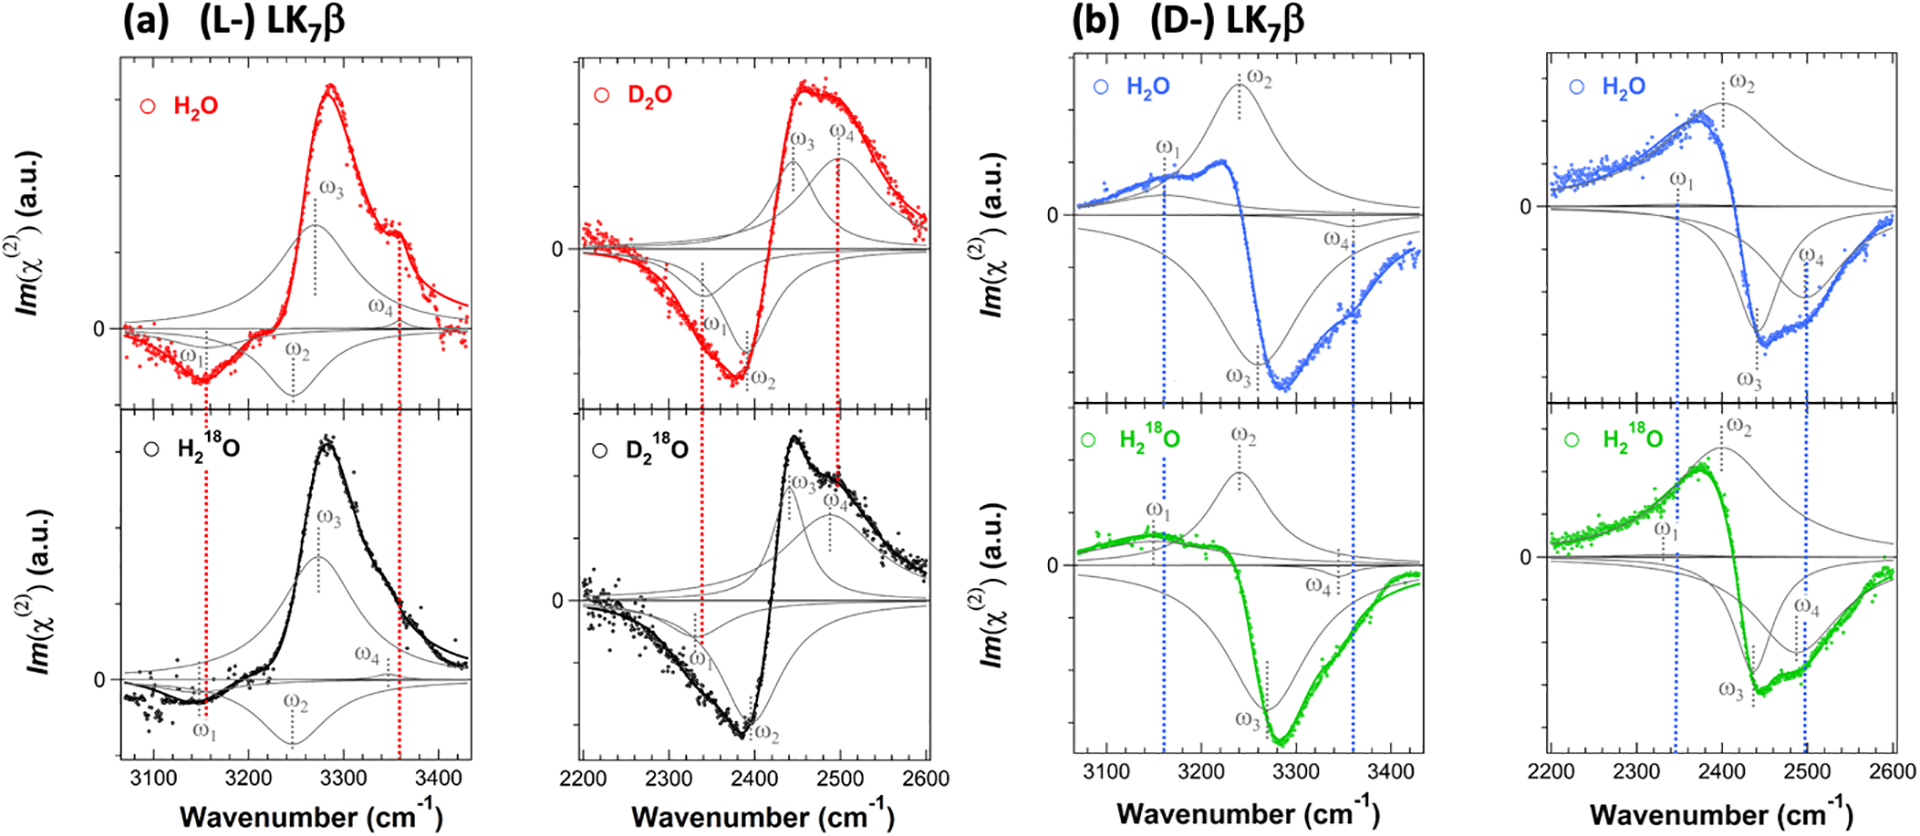
Figure 6. Phase-resolved chiral SFG spectra of LK7β on quartz surface.

(a) (L-) LK7β and (b) (D-) LK7β. Chiral SFG spectra in the O-H/N-H region (~3200 cm−1) of LK7β prepared in H2O and H218O and chiral SFG spectra in the O-D/N-D region (~2400 cm−1) of LK7β prepared in D2O and D218O. All spectra are fit to Lorentzian lineshapes. Individual vibrational bands based on the fitting are shown in gray, and the sum of these peaks are shown in solid lines. Red or blue dashed lines indicate perturbation by 18O substitution for the highest (ω1) and lowest (ω4) vibrational bands that are assigned to water O-H stretching. The two middle (ω2 and ω3) bands are not impacted by 18O substitution and are assigned to protein N-H or N-D stretches. The parameters fitting the four spectra of (L-) LK7β are comparable to those of (D-) LK7β, except the phase of each vibrational band reverses. Adapted with permission from ref 3. Copyright 2020 National Academy of Science.
