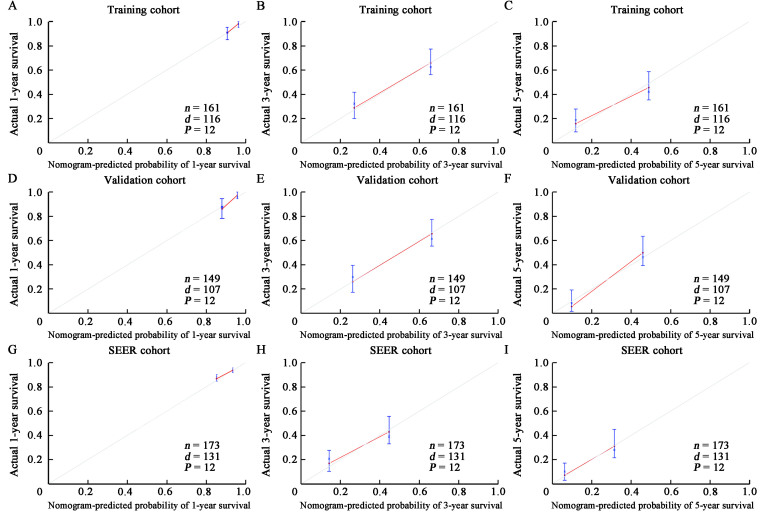
Figure 3.
The calibration curve of OS was predicted by the training, validation, and SEER groups of BCBM patients. 1-year, 3-year, and 5-year OS in the training cohort (A–C; C-index = 0.714), validation cohort (D–F; C-index = 0.710), and SEER cohort (G–I; C-index = 0.670). BCBM: Breast cancer brain metastasis; d: Number of deaths; n: Number of cases; OS: Overall survival; P: Sample size per calculation; SEER: Surveillance, Epidemiology, and End Results Program.

