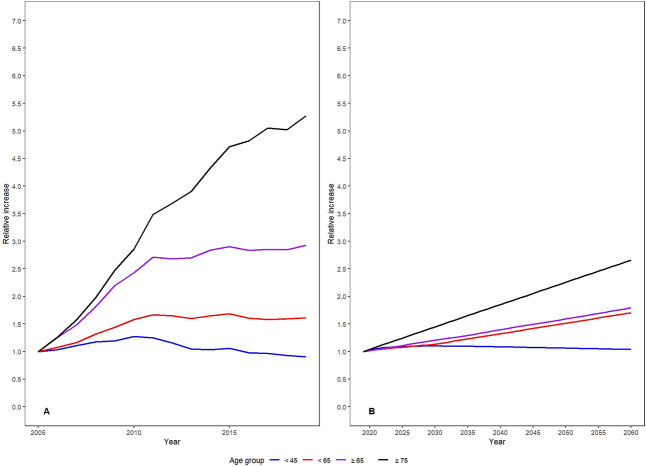
Fig. 1.
(A) The historical relative increase in posterior spinal fusion procedures performed from 2005 to 2019 in relation to the numbers of 2005 (per age group) is shown here. (B) This figure shows the estimated relative increase of posterior spinal fusions performed from 2019 to 2060 in relation to the number from 2019 (per age group). A color image accompanies the online version of this article.

