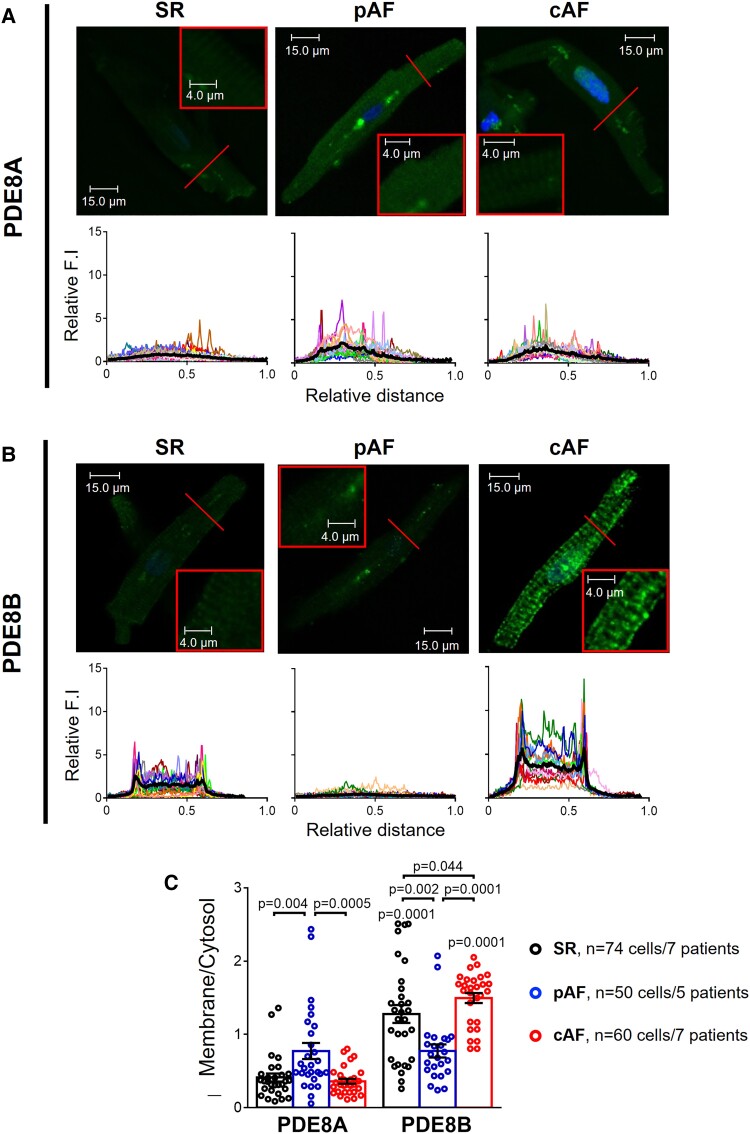
Figure 2.
PDE8A and PDE8B localization in human atrial myocytes. (A) Representative immunocytochemistry confocal images of PDE8A showing its cytosolic distribution in 36 isolated human atrial myocytes (HAMs) from 7 sinus rhythm (SR), 25 HAMs from 5 paroxysmal atrial fibrillation (pAF) and 29 HAMs from 7 persistent (chronic) atrial fibrillation (cAF) patients. Lower panels show transversal line profiles of fluorescence intensity (F.I.) of PDE8A staining for all the myocytes analyzed (thin colored lines) and the average within all cells (thick black lines). (B) Similar representative immunocytochemistry confocal images and fluorescence intensity profiles of PDE8B showing mainly plasma membrane localization of this PDE isoform, in 38 HAMs from 7 SR, 25 HAMs from 5 pAF and 31 HAMs from 7 cAF patients. (C) Average F.I. of PDE8A and PDE8B at the plasma membrane (first and last 10% of the cell width) related to the F.I. in the cytosol (middle), in SR, pAF, and cAF. *P < 0.05 between groups of patients, # P < 0.05 vs. PDE8A, by mixed ANOVA followed by Wald χ2 test and Sidak multiple comparison test. All images were captured under the same conditions in order to obtain comparable fluorescence intensities.

