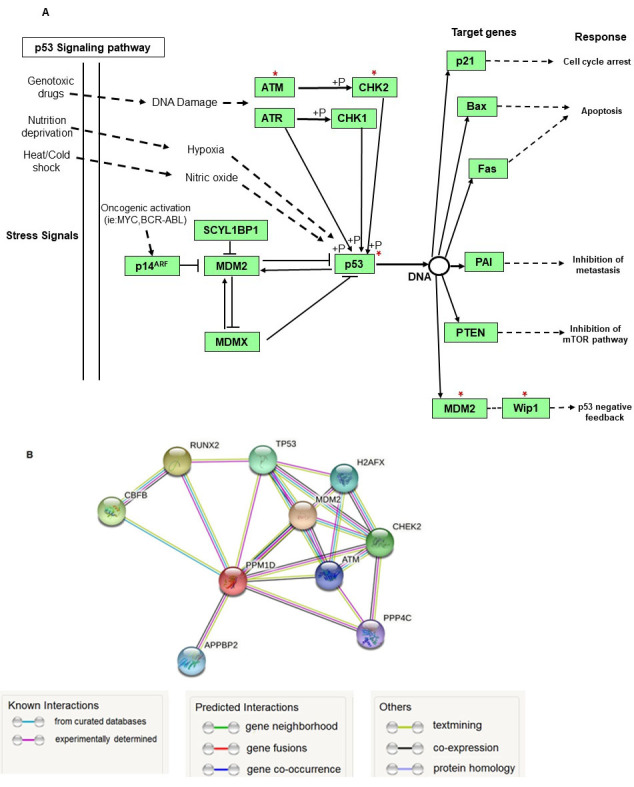
Figure 1.

The importance of WIP1 in the p53 signaling pathway and its Protein–protein interaction network. (A) The p53 pathway map (map04115) was provided using the KEGG database. The red stars above each gene represent the genes whose activity is affected by WIP1 via dephosphorylation; (B) WIP1 Protein-protein interaction network was visualized by STRING with high confidence (0.7). The edges represent protein-protein associations which are meant to be specific and meaningful. This does not necessarily mean they are physically binding to each other. MDM2: Mouse Double Minute 2 Homolog; WIP1: Wild-type p53-Induced Phosphatase 1.
