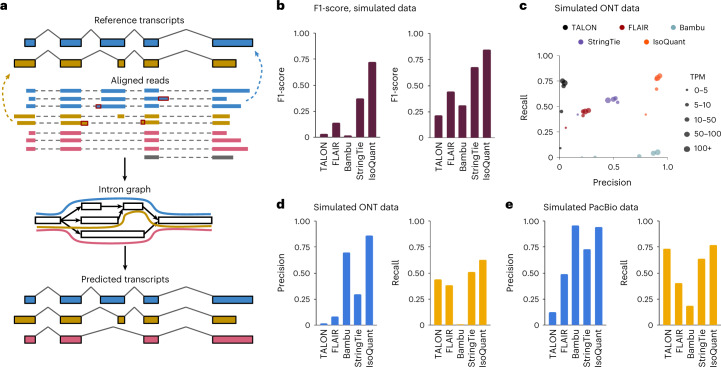
Fig. 1. IsoQuant pipeline outline and characteristics of novel transcripts generated from mouse simulated data.
a, Outline of the IsoQuant pipeline. When a reference gene annotation is provided, reads are assigned to annotated isoforms and alignment artifacts are corrected (top). The intron graph is constructed from read alignments (middle) and transcripts are discovered via path construction (bottom). b, F1-score for novel transcripts reported by different tools on simulated ONT (left) and PacBio data (right). c, Precision and recall for novel transcripts reported by different tools on simulated ONT data broken up by expression levels in TPM. TPM bins are presented by dot sizes. d, Precision (left) and recall (right) for novel transcripts reported by different tools on simulated ONT data. e, Same as d, but for simulated PacBio data.

