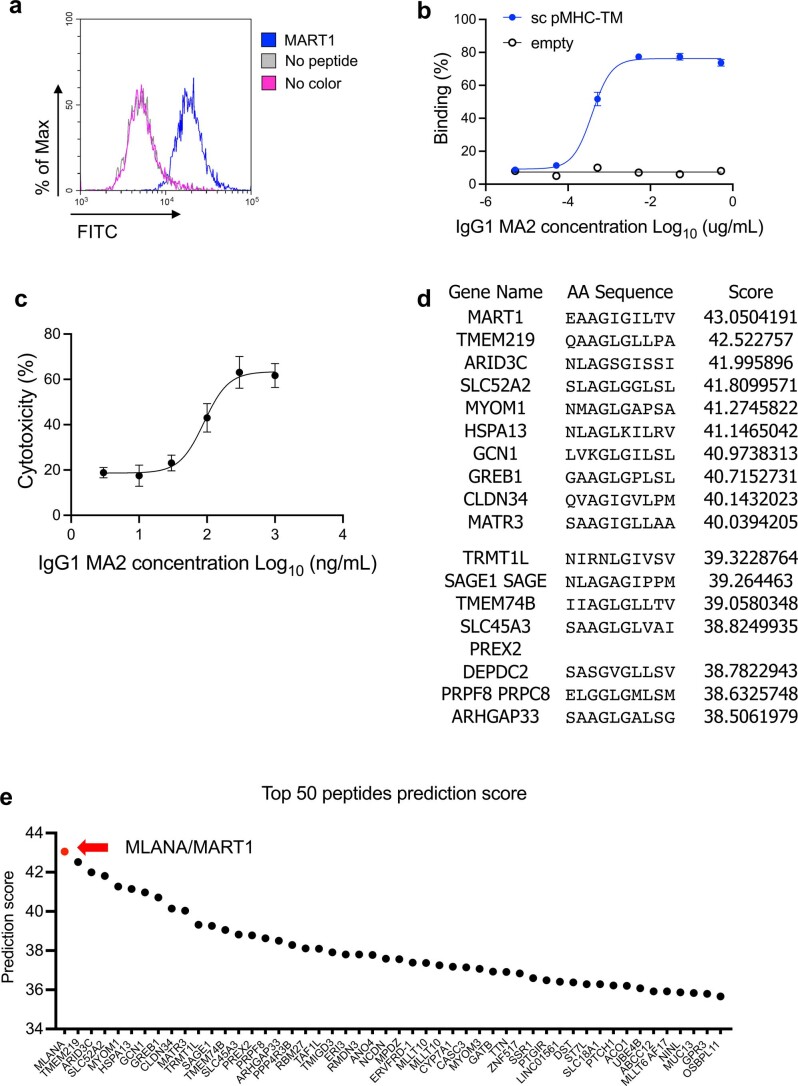
Extended Data Fig. 6. Characterization of MA2 specificity.
a TCRm IgG1 for MART1/HLA-A*02:01, MA2, bound to the MART1 peptide-pulsed A375 cells. b TCRm IgG1 for MART1/HLA-A*02:01, MA2, bound to 293 cells transiently displaying single chain MART126-35 (A2L)/HLA-A*0201. Percentage of AlexaFluor 488 positive cells are shown as mean±s.d. (n = 3 biological replicates). c ADCC activity of MA2 in a dose-dependent manner was measured using CFSE-labeled A375 cells incubated with hPBMC. The CFSE and PI double positive cells were gated and experiment was triplicated. The dead cell percentage are shown as mean±s.d. (n = 3 biological replicates). d Top ranked peptides predicted from human proteome derived from UniProt database. The protein name, peptide sequence and prediction score are shown in the table. e Top 50 peptides are plotted based on their prediction score of MA2 selection on HLA-A*02:01 10mer yeast library. MLANA/MART1 is colored as red dot and rest of predicted putative antigens are colored as black.

