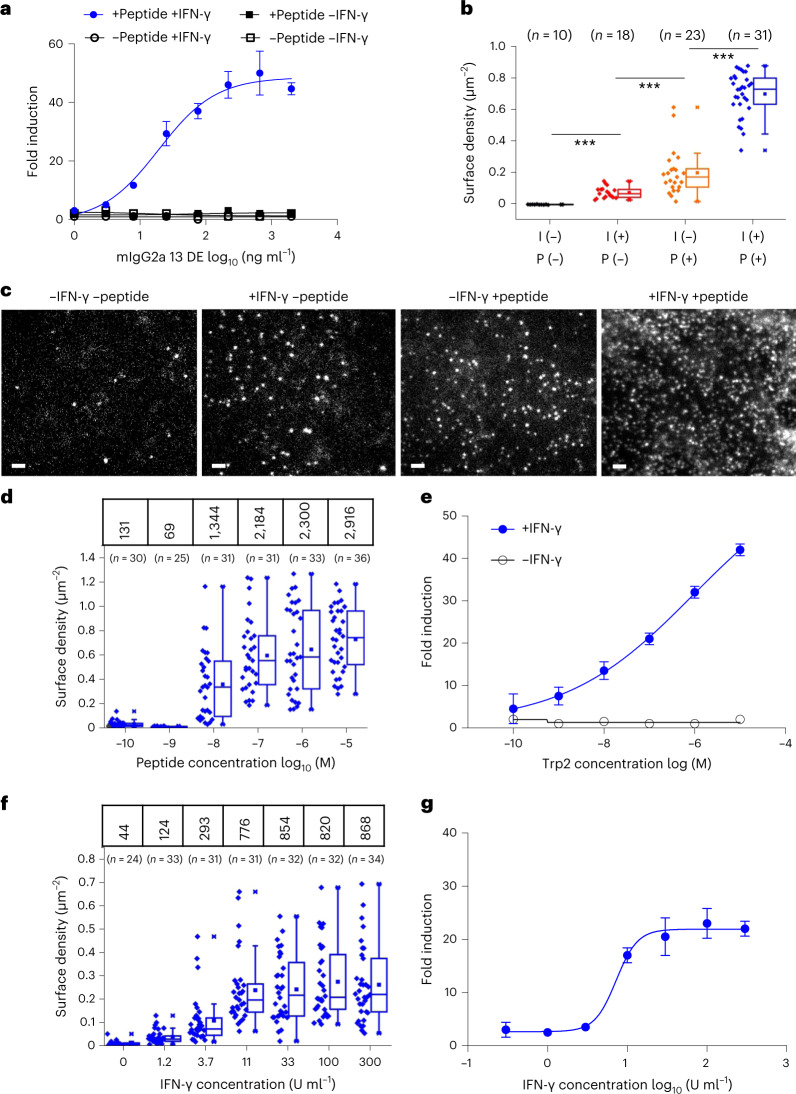
Fig. 3. Correlation between number of presented antigens and ADCC reporter activity.
a, ADCC reporter activity induced by treatment of B16F10 cells with IgG2a 13 DE. B16F10 cells were either pretreated or not with IFN-γ then pulsed or not pulsed with 10 µM Trp2 peptide. ADCC reporter activity was measured using effector cells transiently expressing mFcγRIV and NFAT-luciferase. Representative fold induction (n = 3 independent experiments) shown as mean ± s.d. (n = 3 biological replicates). b, Cell surface density of AT643ALFAnb-stained IgG2a13-ALFA observed for untreated B16F10 and after treatment with IFN-γ (I) and/or Trp2 peptide (P). Given the bivalency of IgG, we expect the maximum number of Trp2-loaded MHCI at the cell surface to be twofold lower. Each data point represents the density of one cell. Box plots indicate data distribution of the second and third quartiles (box), median (line), mean (square) and 1.5× interquartile range (whiskers). Each data point represents the analysis from one cell with the number of cells (n) shown in each dataset. Statistical significance was determined using unpaired Student’s t-test, ***P ≤ 0.001. c, Quantification of Trp2/H2-Kb complexes on the surface of B16F10 cells by single-molecule microscopy. Representative TIRF images for differently treated cells obtained after staining with ALFA-tagged mTCRm IgG2a 13 (IgG2a13-ALFA) and anti-ALFA nanobody labeled with ATTO643 (AT643ALFAnb). Scale bars, 2 µm. d, Density of IgG2a 13-ALFA on the surface of B16F10 cells pretreated with 100 IU ml–1 IFN-γ and pulsed with different concentrations of Trp2 peptide. IgG2a13-ALFA was stained with a mixture of Rho11ALFAnb and AT643ALFAnb. Numbers at the top correspond to mean number of IgG2a13-ALFA per cell. Imaging data on antigen density were obtained under the same conditions as ADCC assays. Box plots indicate data distribution of the second and third quartiles (box), median (line), mean (square) and 1.5× interquartile range (whiskers). Each data point represents the analysis from one cell, with the number of cells (n) shown in each dataset. e, ADCC activity was measured using effector cells transiently expressing mFcγRIV and NFAT-luciferase under the same conditions as in d. Representative fold induction (n = 2 independent experiments) is shown as mean ± s.d. (n = 2 biological replicates). f, Density of IgG2a 13-ALFA on the surface of B16F10 cells pretreated with IFN-γ at different concentrations. After treatment with IgG2a13-ALFA, cells were stained with AT643ALFAnb. Numbers at the top correspond to the mean number of IgG2a13-ALFA per cell. Box plots indicate the data distribution of the second and third quartiles (box), median (line), mean (square) and 1.5× interquartile range (whiskers). Each data point represents the analysis from one cell, with the number of cells (n) depicted in each dataset. g, ADCC activity was measured using effector cells transiently expressing mFcγRIV and NFAT-luciferase under the same conditions as in f. Trp2 peptide concentration was 10 µM. Representative fold induction (n = 2 independent experiments) is shown as mean ± s.d. (n = 2 biological replicates).

