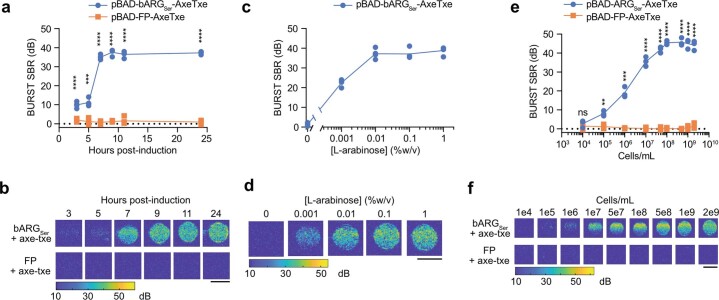
Extended Data Fig. 5. In vitro characterizations of bARGSer-expressing EcN with BURST ultrasound imaging.
(a-b) BURST ultrasound signal-to-background ratio (SBR) versus time after inducing pBAD-bARGSer-AxeTxe and pBAD-FP-AxeTxe EcN strains with 0.1% L-arabinose in liquid culture at 37 °C (p values from left to right: 9.866231E-05, 0.00019939, 5.648535E-09, 9.858233E-09, 1.069657E-07, 1.161991E-09) (a) and the corresponding representative BURST images (b). (c-d) BURST ultrasound SBR versus L-arabinose concentration used to induce pBAD-bARGSer-AxeTxe EcN in liquid culture at 37 °C for 24 hours (c) and the corresponding representative BURST images. (e-f) BURST ultrasound SBR versus concentration of pBAD-bARGSer-AxeTxe or pBAD-FP-AxeTxe EcN cells induced for 24 hours at 37 °C with 0.1% L-arabinose in liquid culture (p values from left to right: 0.420535, 0.00261501, 0.000335619, 1.899074E-05, 2.348183E-06, 2.055919E-07, 2.793374E-06, 9.045661E-06, 1.487459E-05) (e) and the corresponding representative BURST images (f). Note that the BURST SBR saturated at 7 hours post-induction, 0.01% (w/v) L-arabinose, and 108 cells/mL. All scale bars are 2 mm. For (a-d), cells were normalized to 109 cells/mL in agarose phantoms for ultrasound imaging. For (a, c, e), each point is a biological replicate (n = 4 for a and c; n = 3 for e) that is the average of at least 2 technical replicates and curves indicate the mean. Asterisks represent statistical significance by two-tailed, unpaired Student’s t-tests (**** = p < 0.0001, *** = p < 0.001, ** = p < 0.01, ns = no significance).

