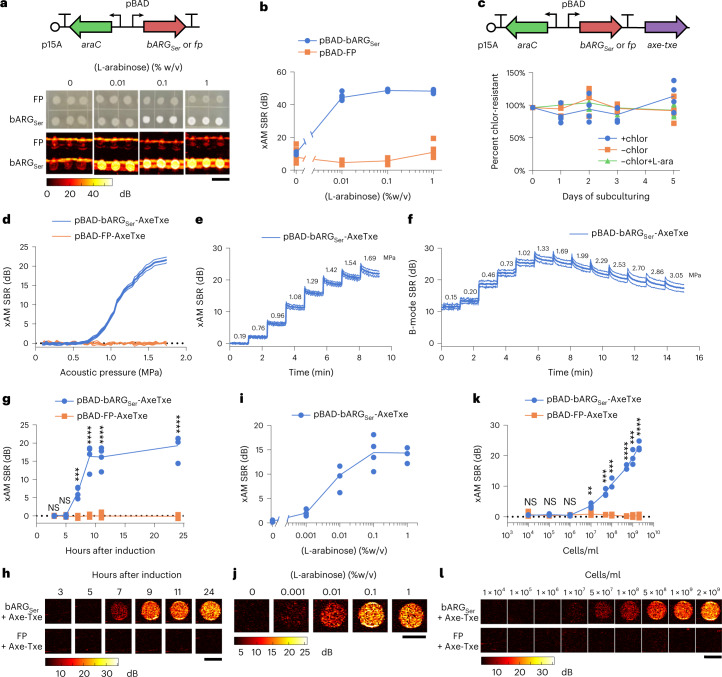
Fig. 2. Expression of bARGSer in EcN and acoustic characterization in vitro.
a, Diagram of the arabinose-inducible construct pBAD-bARGSer used to express bARGSer in EcN (top) and optical and xAM images of bARGSer-expressing or FP-expressing patches of EcN on solid media with varying L-arabinose concentrations (bottom). Scale bar, 1 cm. See Extended Data Fig. 3 for corresponding results with IPTG-inducible and aTc-inducible constructs. b, Quantification of xAM signal-to-background ratio (SBR) of patches from a versus the L-arabinose concentration (n = 8). c, Diagram of the construct from a with Axe-Txe47 added, creating pBAD-bARGSer-AxeTxe, to enable plasmid maintenance in the absence of antibiotics (top) and verification of plasmid maintenance (bottom). Conditions were with chloramphenicol (+chlor), without chloramphenicol (−chlor) or without chloramphenicol and with 0.1% L-arabinose (−chlor +L-ara) using pBAD-bARGSer-AxeTxe EcN (n = 4). d, xAM SBR as a function of transmitted acoustic pressure. e,f, xAM (e) and parabolic B-mode (f) SBRs measured over time when the transmitted acoustic pressure was increased every ~70 seconds, and the pulse repetition rate was 86.8 Hz. For d–f, cells were induced with 0.1% L-arabinose for 24 hours. Bold lines represent the mean, and thin lines represent ± standard deviation (n = 3 biological replicates, each with two technical replicates). g,h, xAM ultrasound SBR (g) and corresponding representative images (P values: 0.519494, 0.240386, 0.000120555, 6.818737 × 10⁻⁵, 3.683585 × 10⁻⁵ and 2.325819 × 10⁻⁵) (h) at several timepoints after inducing with 0.1% L-arabinose. i,j, xAM SBR (i) and corresponding representative images (j) after inducing with varying L-arabinose concentrations for 24 hours. k,l, xAM SBR (P values: 0.699456, 0.0568424, 0.597418, 0.00906739, 0.00046697, 0.000456979, 4.937128 × 10⁻⁶, 0.000183889 and 1.708183 × 10⁻⁵) (k) and corresponding representative images (l) of varying concentrations of cells induced for 24 hours with 0.1% L-arabinose in liquid culture. For h,j,l, scale bars are 2 mm. For d–j, cells were grown in liquid culture and normalized to 109 cells per milliliter for ultrasound imaging. For g,i,k, each point is a biological replicate (n = 4 for g and i; n = 3 for k) that is the average of at least two technical replicates. Curves represent the mean for b–k. Asterisks represent statistical significance by two-tailed, unpaired Student’s t-tests (****P < 0.0001; ***P < 0.001; **P < 0.01; NS, not significant).

