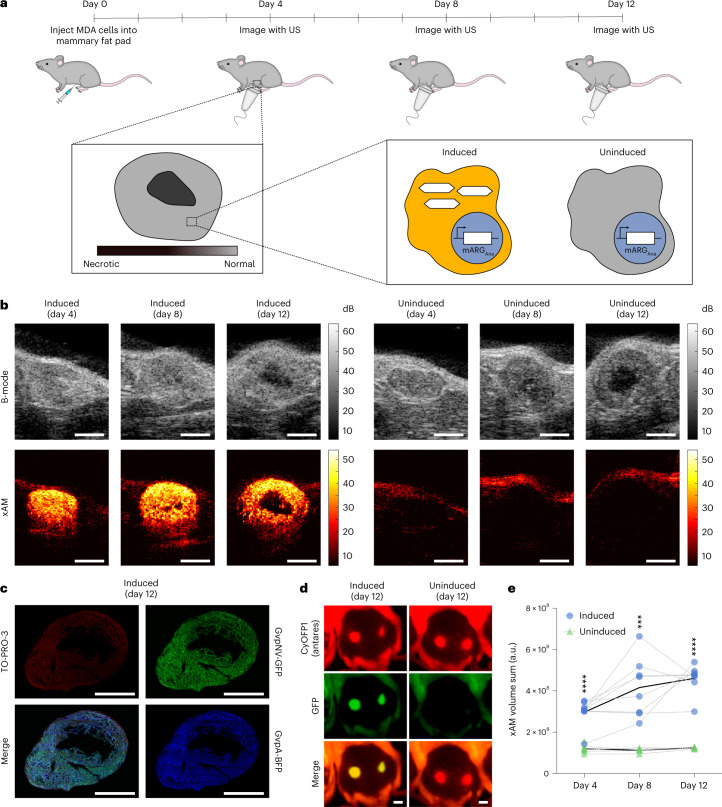
Fig. 5. In situ mARGAna expression enables non-destructive ultrasound imaging of orthotopic tumors.
a, Diagram of the in vivo protocol for assessing in situ mARGAna expression in orthotopic tumors. Mice were injected bilaterally in the 4th mammary fat pads with engineered MDA-MB-231-mARGAna human breast adenocarcinoma cells on day 0. mARGAna expression was induced by regular intraperitoneal doxycycline injections starting from the day of tumor injections. Tumors were imaged with ultrasound (US) after 4, 8 and 12 days of expression. b, Representative middle sections of B-mode and xAM US tomograms of MDA-MB-231 mARGAna tumors induced with doxycycline (left; n = 8 tumors from four mice) and uninduced control (right; n = 7 tumors from four mice on day 4 and n = 5 tumors from four mice on days 8 and 12) imaged on days 4, 8 and 12. Scale bars, 2 mm. See Supplementary Video 1 for the full US tomogram of the induced tumor at day 12. c, Fluorescence micrograph of a 100-μm-thin tumor section (representative of n = 2 tumors). Green color shows GFP fluorescence; blue color shows BFP fluorescence; and red color shows TO-PRO-3 nuclear stain. See Extended Data Fig. 9 for the uninduced control (n = 1 tumor). Scale bars, 2 mm. d, Whole-animal fluorescence imaging of induced (left; n = 8 tumors from four mice) and uninduced (right; n = 5 tumors from three mice) tumors after 12 days of expression. All tumors are constitutively expressing CyOFP1 (Antares, red), whereas mARGAna expression is linked to expression of GFP (green). The left (reader’s right) tumors are shown in b. Scale bars, 5 mm. e, 3D sum of xAM signal from US tomograms of induced (n = 8) and uninduced (n = 7 tumors from four mice on day 4 and n = 5 tumors from four mice on days 8 and 12) tumors from one experiment, plotted on a linear scale in arbitrary units (a.u.). Black curves connect the means, and gray curves connect points for each mouse. Asterisks represent statistical significance by two-tailed, unpaired Student’s t-tests between induced and uninduced conditions (P values from left to right: 0.000622, 0.001554 and 0.001554) (****P < 0.0001 and ***P < 0.001).

