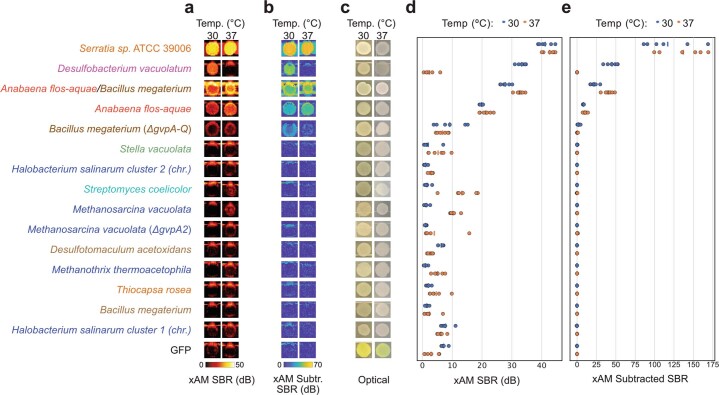
Extended Data Fig. 1. Additional images and quantification of E. coli patches expressing select GV gene clusters.
(a-c) xAM images (a), pre-minus-post-collapse xAM images (b), and optical images showing opacity (c) of patches of E. coli expressing various GV gene clusters from the organisms listed on the left. (d-e) Quantification of the xAM (d) and pre-minus-post-collapse xAM (e) signals from images in (a-b) (n = 6 biologically independent samples examined in one experiment). SBR, signal-to-background ratio.

