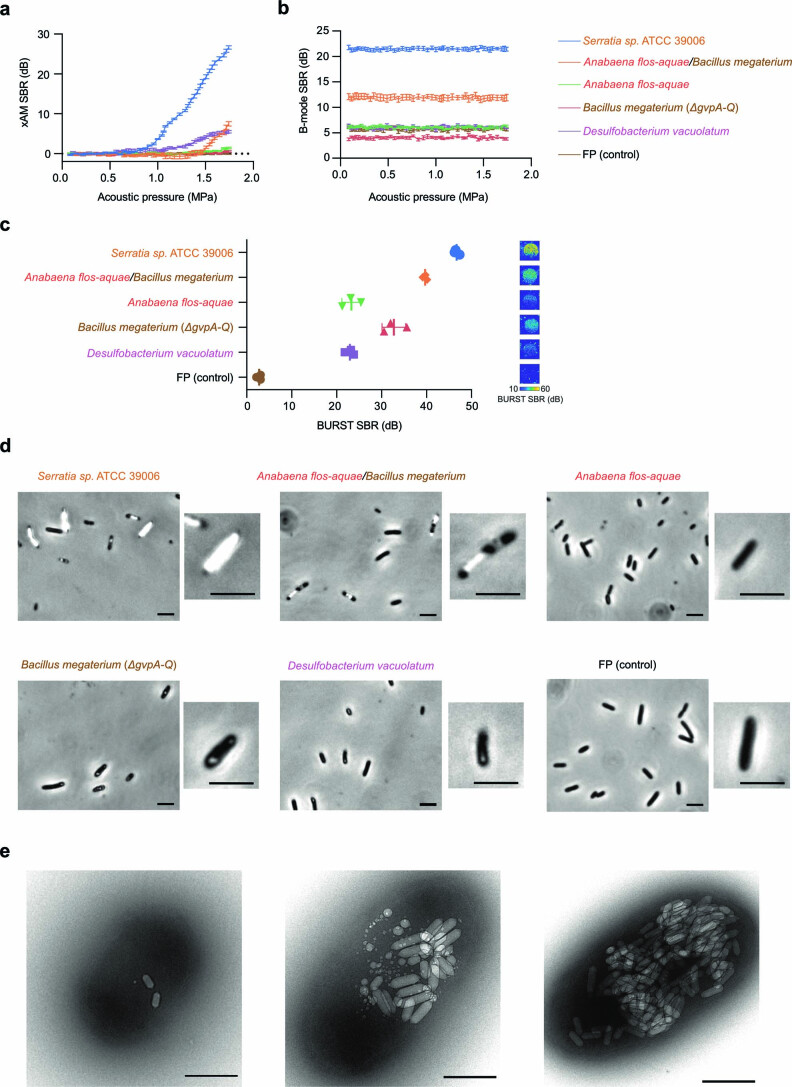
Extended Data Fig. 2. Characterization of working GV clusters in BL21(DE3) E. coli.
(a-d) xAM signal-to-background ratio (SBR) as a function of acoustic pressure (a), B-mode SBR at a constant pressure of 0.15 MPa after each increase in acoustic pressure in a (b), BURST SBRs and corresponding representative images (c), and representative phase contrast microscopy (PCM) images (from at least n = 3 biological replicates) (d) of the working GV clusters expressed in BL21(DE3) E. coli at 30 °C on solid media. For ultrasound imaging (a-c), samples were normalized to 5 × 10⁹ cells/mL in agarose phantoms. Curves and error bars represent the mean (n = 3 biological replicates each with 2 technical replicates) ± SD. (a-b) have the same legend. GV clusters in cells are visible by PCM for all clusters except for the cluster from Anabaena flos-aquae and the fluorescent protein (FP) control (d). (e) Representative TEM images of BL21(DE3) E. coli cells expressing Serratia GVs at varying levels of expression (from n = 17 images from a single sample). Scale bars are 5 μm in (d) and 500 nm in (e).

