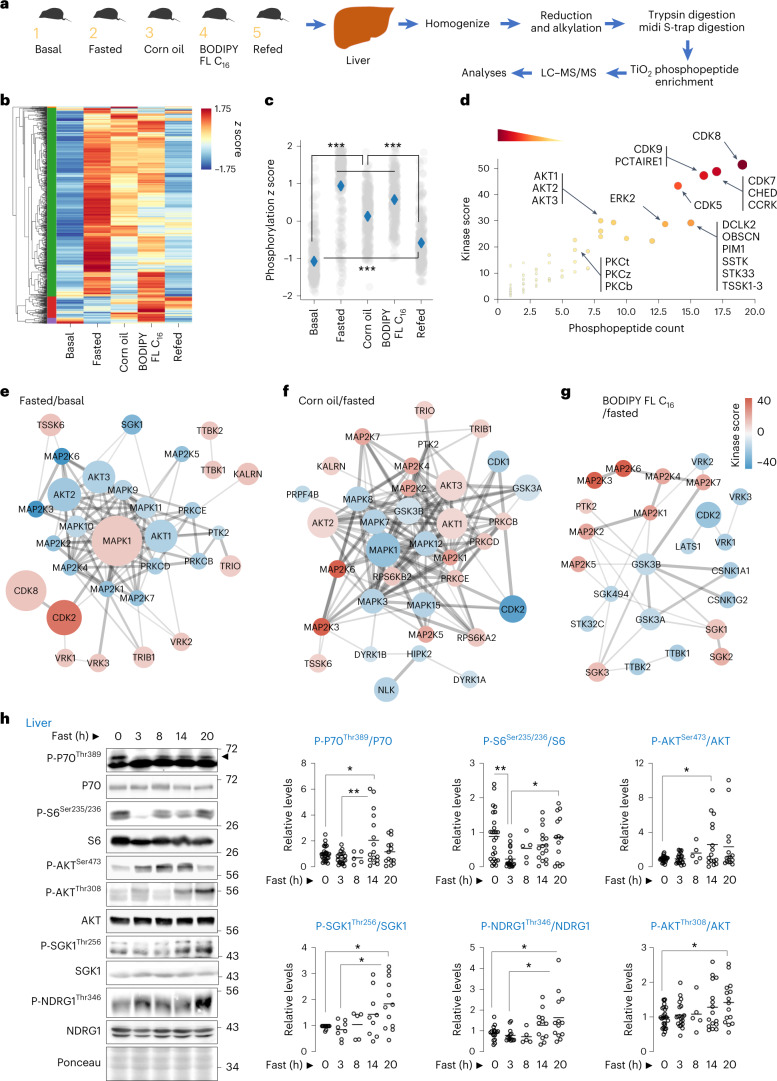
Fig. 1. Phosphoproteomics reveal kinases that respond to fasting or lipids.
a, Phosphoproteomics in livers as per plan in cartoon. b, Heat map and hierarchical clustering of phosphosites across groups indicated in a. c, Phosphoproteome-wide comparisons via z score normalization of phosphosites in green cluster. Grey dots represent individual phosphosites. Blue diamonds represent group means. ***P < 0.001, non-parametric ANOVA (Kruskal–Wallis statistic 797.3, P < 0.0001) followed by Dunn’s multiple comparisons test. d, iGPS prediction of upstream individual kinases that respond to lipids across groups indicated and identified in the green cluster in b. e–g, Pairwise comparisons between indicated groups (fasted versus basal (e), corn oil versus fasted (f), and BODIPY FL C16 versus fasted (g)), showing upregulated or downregulated kinase networks. For a–g, n = 4 mice. For d, darker colour intensity reflects higher kinase score. h, Immunoblots (IB) and quantification for indicated proteins in livers of 2–10-month-old male and female mice that were fed or fasted for indicated durations. N values for number of mice analysed at each timepoint for individual phosphoproteins are indicated in parentheses. P-P70Thr389/P70: 0 h (n = 27), 3 h (n = 21), 8 h (n = 5), 14 h (n = 16) and 20 h (n = 14); P-S6Ser235/236/S6: 0 h (n = 26), 3 h (n = 20), 8 h (n = 5), 14 h (n = 16) and 20 h (n = 14); P-AKTSer473/AKT: 0 h (n = 26), 3 h (n = 21), 8 h (n = 5), 14 h (n = 16) and 20 h (n = 15); P-SGK1Thr256/SGK1: 0 h (n = 11), 3 h (n = 9), 8 h (n = 4), 14 h (n = 9) and 20 h (n = 12); P-NDRG1Thr346/NDRG1: 0 h (n = 17), 3 h (n = 14), 8 h (n = 5), 14 h (n = 12) and 20 h (n = 13); and P-AKTThr308/AKT: 0 h (n = 27), 3 h (n = 20), 8 h (n = 5), 14 h (n = 16) and 20 h (n = 15). Ponceau is loading control. Individual replicates and means are shown. *P < 0.05 and **P < 0.01, one-way ANOVA followed by Tukey’s multiple comparisons test (h). Please refer to Supplementary Table 10 statistical summary, and Supplementary Tables 1 and 2. Source numerical data are available in Source Data Extended Data Table 1, and unprocessed blots are available in the Source Data for this figure.

