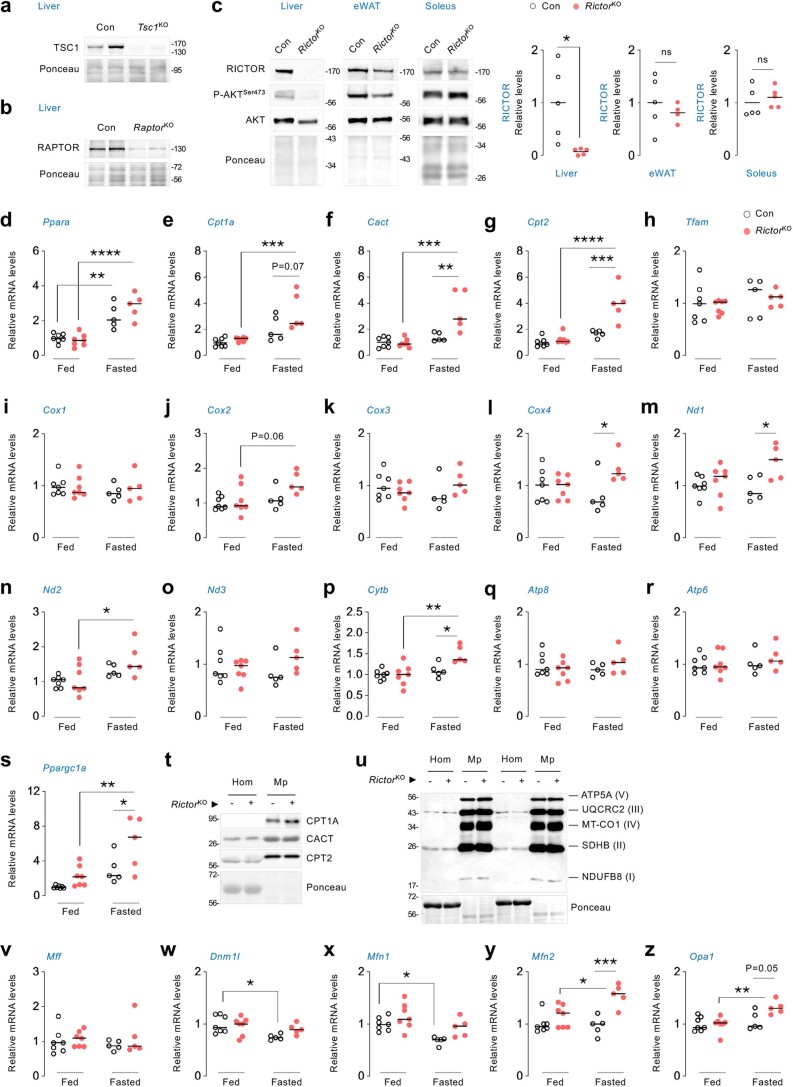
Extended Data Fig. 3. Effect of loss of mTORC2 on expression of genes and proteins related to mitochondrial oxidative metabolism and dynamics.
(a, b) Representative IB to validate deletion of the indicated genes in livers of 4–6 mo-old Con, Tsc1KO or RaptorKO male and female mice. Blots for TSC1 and RAPTOR are representative of n = 7 Con or corresponding KO mice obtaining similar results. (c) IB for mTORC2 signaling and quantification of RICTOR protein levels in liver (n = 5 mice), epididymal white adipose tissue (eWAT) (n = 5 Con and n = 4 RictorKO mice) and soleus (n = 5 mice) of 4–6 mo-old Con and RictorKO male mice fasted for 14–16 h. (d-s and v-z) Relative mRNA expression of indicated genes in livers of 4–6 mo-old Con and RictorKO male mice that were fed or fasted for 14–16 h (n = 7 fed Con or RictorKO mice, and n = 5 fasted Con or RictorKO mice). (t) Representative IB for proteins involved in mitochondrial fatty acid uptake, and (u) OXPHOS in whole homogenates (Hom) and pure mitochondrial (Mp) fractions from livers of 5–6 mo-old Con and RictorKO male mice after 14–16 h fasting (n = 3 Con and n = 5 RictorKO mice). Ponceau is the loading control. Individual replicates and mean values are shown. *P < 0.05, **P < 0.01, ***P < 0.001 and ****P < 0.0001, two-tailed unpaired Student’s t-test (c); 2-way ANOVA followed by Tukey’s multiple comparisons (d-s and v-z). ns=not significant. Please refer to Supplementary Table 10_statistical summary. Source numerical data are available in SourceData_Table 1, and unprocessed blots are available in Source Data Extended Data Fig. 3.

