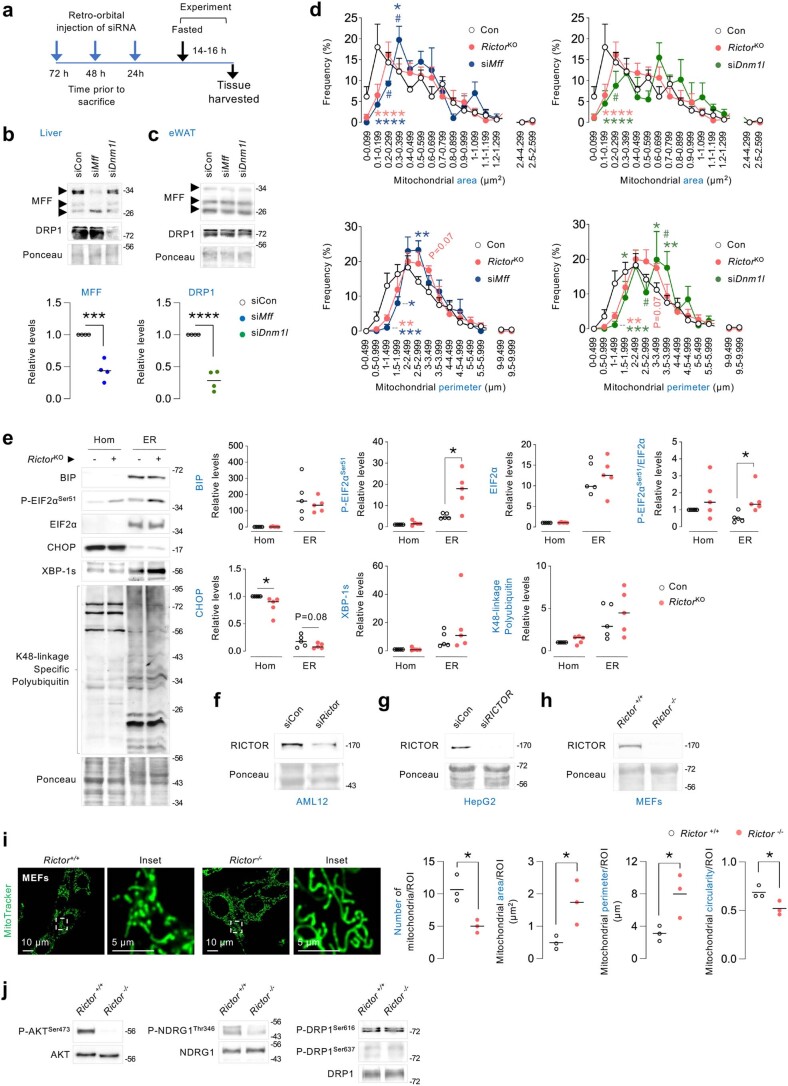
Extended Data Fig. 5. Fasting-induced mitochondrial fission is mTORC2-dependent.
(a) Experimental plan and (b-c) representative IB for indicated proteins in (b) livers and (c) eWAT of 4–9 mo-old male mice injected with siCon, siMff or siDnm1l and fasted for 14–16 h (n = 4 mice). Quantifications for loss of MFF and DRP1 protein levels in liver are shown. (d) Frequency histograms depicting distribution of mitochondrial area and perimeter in Con, RictorKO and siMff or siDnm1l livers. N values for number of mice are in parenthesis: Con (n = 6), RictorKO (n = 6), siMff (n = 4), and siDnm1l (n = 4). Mean ± SEM is shown. (e) IB and quantification for indicated ER-stress and proteostasis markers in Hom and ER fractions from livers of 6 mo-old Con and RictorKO mice fasted for 14–16 h (n = 5 mice). (f-h) Representative IB for RICTOR in siCon or siRictor (f) AML12 or (g) HepG2 cells, or in (h) Rictor +/+ and Rictor -/- MEFs. RICTOR blots are representative of independent experiments obtaining similar results in AML12 (n = 4), HepG2 (n = 3), and MEF (n = 7) cells. (i) Representative confocal images of Rictor +/+ and Rictor -/- MEFs cultured in serum-free medium for 30 min in presence of MitoTracker green. Magnified insets are shown. Quantification for mitochondrial number and mitochondria size/shape descriptors is shown (Rictor+/+ 36 cells and Rictor-/- 43 cells from n = 3 independent experiments). (j) Representative IB for indicated proteins in Rictor+/+ and Rictor-/- MEFs (n = 3 independent experiments). Ponceau is loading control. Individual replicates and mean values are shown. *P < 0.05, **P < 0.01, ***P < 0.001 and ****P < 0.0001 are versus Con; #P < 0.05 versus RictorKO, two-tailed unpaired student’s t-test (b, e and i); One-way ANOVA followed by Tukey’s multiple comparisons test (d). Please refer to Supplementary Table 10_statistical summary. Source numerical data are available in SourceData_Table 1, and unprocessed blots are available in Source Data Extended data Fig. 5.

