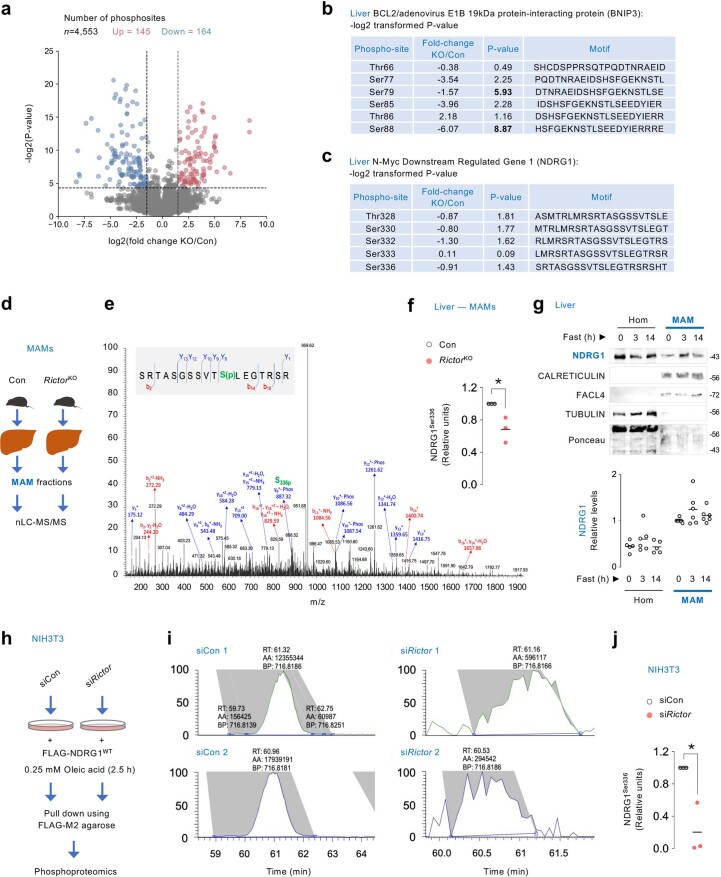
Extended Data Fig. 6. Phosphoproteomics reveal mTORC2 phosphorylation of NDRG1 at Ser336 in MAMs.
(a) Volcano plot for phosphoproteomics in 14–16 h fasted Con and RictorKO livers. The numbers indicate total phosphosites. Red and blue dots represent significantly increased (P < 0.05 and log2(fold change)>1.5) and decreased (P < 0.05 and log2(fold change)<1.5) phosphosites, respectively. (b, c) Tables showing fold-change and log2 transformed P-values for indicated phosphorylations on liver (b) BNIP3, and (c) NDRG1 from 3–4-mo-old liver-specific RictorKO mice fasted for 14–16 h. For a-c (n = 3 mice). (d) MAMs of 4–6 mo-old Con and RictorKO livers from 14–16 h fasted mice were subjected to phosphoproteomics. (e) Annotated MS/MS spectrum of phosphopeptide SRTASGSSVTS(p)LEGTRSR in NDRG1, wherein S(p) represents phosphorylated Ser336. (f) Quantification for SRTASGSSVTS(p)LEGTRSR peptide in NDRG1 in MAMs is shown, with relative abundance of SRTASGSSVTS(p)LEGTRSR in Con or RictorKO MAMs. For d-f (n = 3 samples wherein 2 livers were pooled to generate 1 sample). (g) Representative IB and quantifications for indicated proteins in Hom and MAM fractions from livers of 2–10 mo-old male mice fed or fasted for indicated time points. N values for number of mice at each time point are in parenthesis: Hom 0 h and 14 h (n = 5); Hom 3 h (n = 6); and all time points for MAMs (n = 6). Ponceau is the loading control. (h) Experimental plan to pulldown FLAG-NDRG1WT in siCon or siRictor NIH3T3 cells co-transfected with FLAG-NDRG1WT plasmid for assessment of phosphorylation of FLAG-NDRG1WT via phosphoproteomics. FLAG-NDRG1WT pulled-down from total lysates of serum-deprived siCon or siRictor NIH3T3 cells in presence of OA for 2.5 h. (i) Representative extracted ion chromatograms of SRTASGSSVTS(p)LEGTRSR in FLAG-NDRG1 in siCon and siRictor NIH3T3 cells, and (j) quantification for relative abundance of SRTASGSSVTS(p)LEGTRSR peptide from pulled-down FLAG-NDRG1 from siCon and siRictor cells expressing FLAG-NDRG1WT. For h-j (n = 3 independent experiments). Individual replicates and means are shown. *P < 0.05, two-tailed unpaired Student’s t-test (a-c, f and j). p=phosphorylation. Please refer to Supplementary Table 10_statistical summary. Please refer to Supplementary Table 4(a-c), Supplementary Table 6(e and f), and Supplementary Table 7(i and j). Source numerical data are available in SourceData_Table 1, and unprocessed blots are available in Source Data Extended Data Fig. 6.

