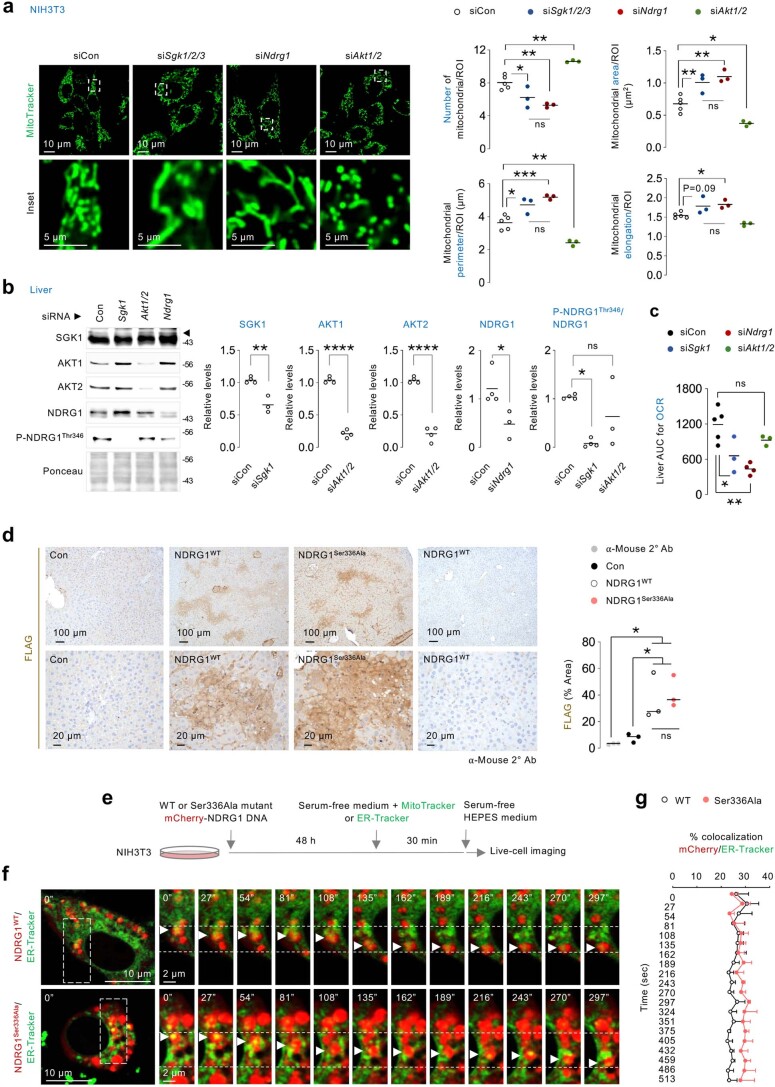
Extended Data Fig. 8. Silencing NDRG1 and SGK1, but not AKT1/2, recapitulates mitochondrial fission failure observed in Rictor silenced cells.
(a) Representative confocal images of NIH3T3 cells silenced for Sgk1/2/3, Ndrg1 or Akt1/2 and cultured in serum-free medium for 30 min in presence of MitoTracker green. Magnified insets are shown. Quantifications for mitochondrial number and mitochondrial size/shape descriptors are shown (siCon 71 cells, siSgk1/2/3 36 cells, siNdrg1 62 cells, and siAkt1/2 36 cells from n = 5 (siCon) and n = 3 (siSgk1/2/3, siNdrg1, and siAkt1/2) independent experiments). (b) IB and quantifications for indicated proteins in livers of 3–4 mo-old male mice injected with siRNAs against Sgk1, Akt1/2 or Ndrg1 and subjected to 14–16 h fasting. N values for number of mice analyzed for indicated proteins are in parentheses. SGK1: siCon (n = 4) and siSgk1 (n = 3); AKT1 and 2: siCon (n = 4) and siAkt1/2 (n = 4); NDRG1: siCon (n = 4) and siNdrg1 (n = 3); P-NDRG1Thr346/NDRG1: siCon (n = 4), siSgk1 (n = 4) and siAkt1/2 (n = 3). (c) AUC for OCR in livers of 14–16 h fasted Con (n = 5), siSgk1 (n = 3), siNdrg1 (n = 4), and siAkt1/2 (n = 3) mice. (d) Immunohistochemistry and quantification for equivalent FLAG expression in livers silenced for endogenous Ndrg1 and then injected with FLAG-tagged WT or Ser336Ala NDRG1 plasmid (n = 3 mice). 2° Ab-only control is shown. (e) Cartoon depicting experimental plan performed in Fig. 5a and Extended Data Fig. 8f. (f) Representative live-cell imaging of mCherry-NDRG1WT or mCherry-NDRG1Ser336Ala and ER-Tracker green in NIH3T3 cells cultured in serum-free medium for 30 min. Magnified insets are shown. White arrowheads: NDRG1 (mCherry)/ER (ER-Tracker) contacts. (h) Quantification for % colocalization of mCherry with ER-tracker in g. Values are mean ± SEM (n = 3 independent experiments). Please refer to Supplementary Video 7 (mCherry-NDRG1WT/ER-Tracker), and Supplementary Video 8 (mCherry-NDRG1Ser336Ala/ER-Tracker). Ponceau is loading control. Individual replicates and means are shown. *P < 0.05, **P < 0.01, ***P < 0.001 and ****P < 0.0001, One-way ANOVA followed by Tukey’s multiple comparisons test (a, c and d); two-tailed unpaired Student’s t-test (b); 2-way ANOVA followed by Tukey’s multiple comparisons test (g). ns=not significant. Please refer to Supplementary Table 10_statistical summary. Source numerical data are available in SourceData_Table 1, and unprocessed blots are available in Source Data Extended Data Fig. 8.

