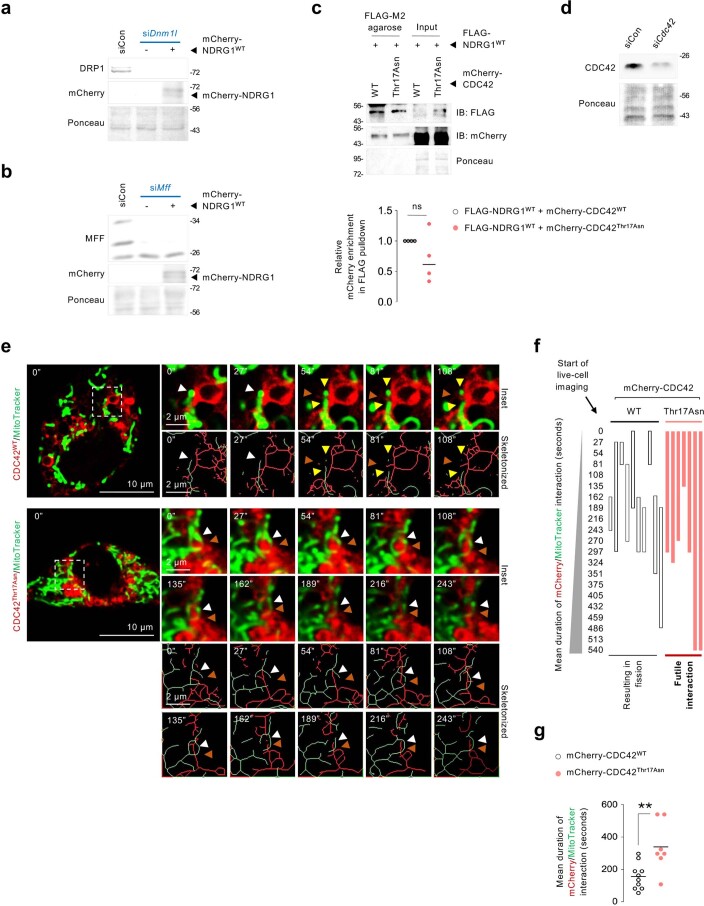
Extended Data Fig. 9. Validating silencing of Dnml1, Mff and Cdc42 in NIH3T3 cells, and time-lapse imaging showing loss of fission in cells expressing the mcherry-CDC42Thr17Asn GTP-binding mutant.
(a, b) Representative IB for indicated proteins in NIH3T3 cells silenced for (a) Dnml1 or (b) Mff and expressing mCherry-tagged NDRG1WT. Blots are representative of n = 3 independent experiments obtaining similar results. (c) IB for FLAG and mCherry in OA-treated (2.5 h) NIH3T3 cells co-expressing FLAG-NDRG1WT and mCherry-CDC42WT or mCherry-CDC42Thr17Asn mutant and subjected to pulldown of FLAG using FLAG M2 agarose (n = 4 independent experiments). Quantification for relative enrichment of mCherry in FLAG pulldowns was calculated by normalizing the densitometry value of mCherry to the densitometry value of FLAG. (d) Representative IB for indicated proteins in NIH3T3 cells silenced for Cdc42 and expressing mCherry-tagged NDRG1WT. CDC42 blot is representative of n = 3 independent experiments obtaining similar results. (e) Representative live-cell imaging in cells expressing mcherry-CDC42WT or dominant negative mcherry-CDC42Thr17Asn mutant in presence of MitoTracker green to label mitochondria. Red arrowheads: CDC42 (mCherry). White arrowheads: CDC42 (mCherry)/mitochondria (MitoTracker) contacts prior to fission. Yellow arrowheads: divided mitochondria after contact with CDC42 (mCherry). Magnified insets are shown. Please refer to Supplementary Video 14 (mCherry-CDC42WT/MitoTracker), and Supplementary Video 15 (mCherry-CDC42Thr17Asn/MitoTracker). (f) Graphical representation for duration of interaction between mCherry-CDC42WT or mCherry-CDC42Thr17Asn and mitochondria (MitoTracker), and whether interactions lead to division or are futile. (g) Quantification for mean duration of interaction (mCherry-CDC42WT 10 cells, and mCherry-CDC42Thr17Asn 7 cells from n = 3 independent experiments. Each tracked cell was monitored on an independent plate). Ponceau is loading control. Individual replicates and means are shown. **P < 0.01, two-tailed unpaired Student’s t-test (c and g). ns=not significant. Please refer to Supplementary Table 10_statistical summary. Source numerical data are available in SourceData_Table 1, and unprocessed blots are available in Source Data Extended Data Fig. 9.

