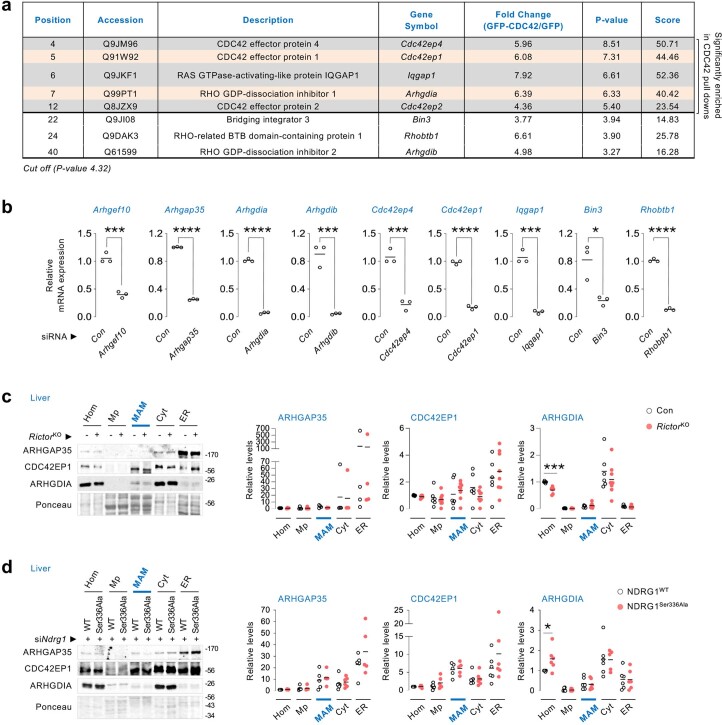
Extended Data Fig. 10. An siRNA screen to target interacting partners of CDC42 reveals effectors and regulators of CDC42 controlling mitochondrial dynamics.
(a) Significantly enriched interacting partners of CDC42 that belong to the RHO family of GTPases. A log2 transformed P-value cut-off of 4.32 was used as threshold (n = 4 independent experiments). (b) qPCR in NIH3T3 cells to validate the silencing of selected CDC42-binding partners identified by proteomics (n = 3 independent experiments). (c, d) IB and quantification for indicated proteins in Hom, Mp, MAMs, Cyt, and ER fractions from livers of (c) 5–6 mo-old Con or RictorKO male mice, and (d) 3–4 mo-old NDRG1WT or NDRG1Ser336Ala male mice co-injected with siRNA against endogenous Ndrg1 and fasted for 14–16 h. N values for number of mice analyzed for individual proteins in indicated fractions are in parentheses. For c, ARHGAP35: all fractions from Con (n = 4) and RictorKO (n = 4) mice; CDC42EP1: all fractions, Con (n = 6) and RictorKO (n = 8) mice except RictorKO Hom where n = 7 mice; ARHGDIA: all fractions from Con (n = 6) mice except Mp, MAMs and ER where n = 5 mice, and all fraction from RictorKO (n = 8) mice except Hom and ER where n = 7 mice. For d, ARHGAP35: all fractions from NDRG1WT and NDRG1Ser336Ala mice are n = 6 except Mp, MAMs and ER from NDRG1WT mice where n = 5; CDC42EP1: all fractions from NDRG1WT and NDRG1Ser336Ala mice are n = 6 except MAMs in both groups where n = 5; ARHGDIA: all fractions from NDRG1WT and NDRG1Ser336Ala mice are n = 6 except Cyt in NDRG1Ser336Ala mice where n = 5. Ponceau is loading control. Individual replicates and means are shown. *P < 0.05, ***P < 0.001 and ****P < 0.0001, two-tailed unpaired Student’s t-test (a-d). GAP: GTPase activating protein; GDI: GDP dissociation inhibitors. Please refer to Supplementary Table 10_statistical summary, and Supplementary Table 9. Source numerical data are available in SourceData_Table 1, and unprocessed blots are available in Source Data Extended Data Fig. 10.

