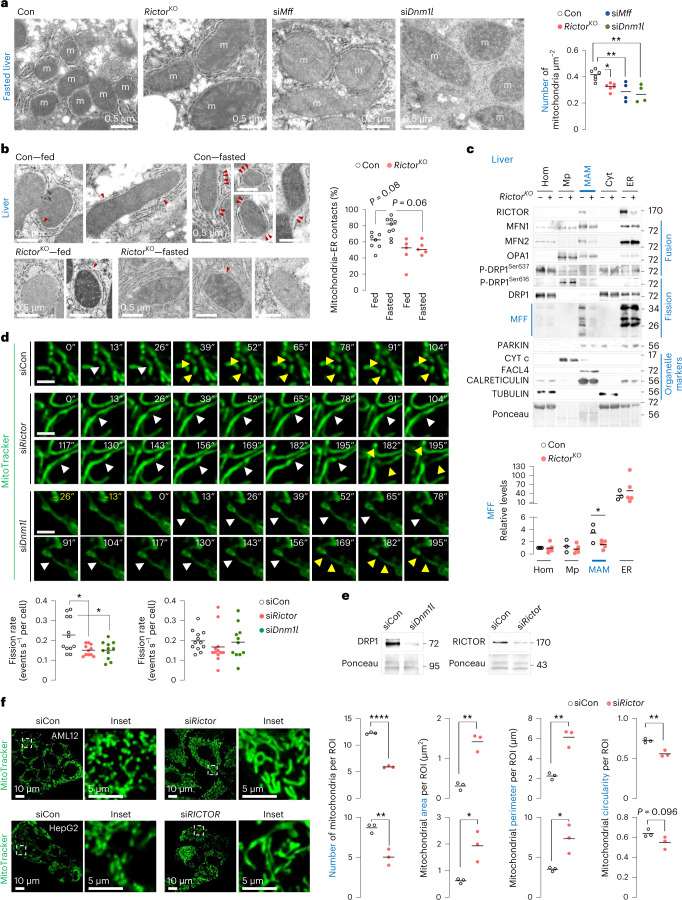
Fig. 3. Loss of mTORC2 blocks fasting-induced mitochondrial fission.
a, Conventional TEM in 14–16 h fasted Con, RictorKO, siMff or siDnm1l livers of 4–9-month-old male mice. N values for number of mice per group are indicated in parentheses. Con or RictorKO mice (n = 6), and siMff or siDnm1l mice (n = 4). Quantification for mitochondrial number is shown. b, TEM in fed or 14–16 h fasted Con and RictorKO livers of 4–9-month-old male mice. Fed Con (n = 7), fasted Con (n = 9) and fed or fasted RictorKO mice (n = 5). Quantification for percentage of mitochondria–ER contacts is shown. Red arrowheads depict contact sites. c, Immunoblots and quantification of indicated proteins in homogenates (Hom), pure mitochondria (Mp), MAMs, cytosol (Cyt) and ER fractions from 14–16 h fasted Con (n = 3) and RictorKO livers (n = 5). Two livers were pooled to generate one sample. d, Live cell imaging and quantification for fission and fusion rates in siCon, siRictor or siDnm1l NIH3T3 cells cultured in serum-free medium for 30 min in presence of MitoTracker green to stain for mitochondria (siCon 12 cells, siRictor 11 cells (fission rate) and n = 12 cells (fusion rate), and siDnm1l 11 cells from n = 8 independent experiments; each cell was tracked on an independent plate). White arrowheads depict mitochondrial constriction sites. Yellow arrowheads depict daughter mitochondria arising from fission at a mitochondrial constriction. Scale bar, 2 µm. Please refer to Supplementary Videos 3 (siCon cells), 4 (siRictor cells) and 5 (siDnm1l cells). e, Representative IB for indicated proteins in siCon, siDnm1l and siRictor NIH3T3 cells. Blots are representative of n = 8 (DRP1) and n = 4 (RICTOR) independent experiments obtaining similar results. f, Representative confocal images of (top) AML12 and (bottom) HepG2 cells knocked down for Rictor, and corresponding controls in serum-free medium for 30 min in presence of MitoTracker green to stain for mitochondria. Magnified insets are shown. Quantifications for mitochondrial number and mitochondrial size/shape descriptors (area, perimeter and circularity) are shown (AML12 45 siCon or siRictor cells; HepG2 35 siCon and 38 siRICTOR cells from n = 3 independent experiments each). Ponceau is loading control. Individual replicates and means are shown. *P < 0.05, **P < 0.01 and ****P < 0.0001, one-way ANOVA followed by Tukey’s multiple comparisons test (a and d); two-way ANOVA followed by Tukey’s multiple comparisons test (b); two-tailed unpaired Student’s t-test (c and f). Please refer to Supplementary Table 10 statistical summary. Source numerical data are available in Source Data Extended Data Table 1, and unprocessed blots are available in the Source Data for this figure.

