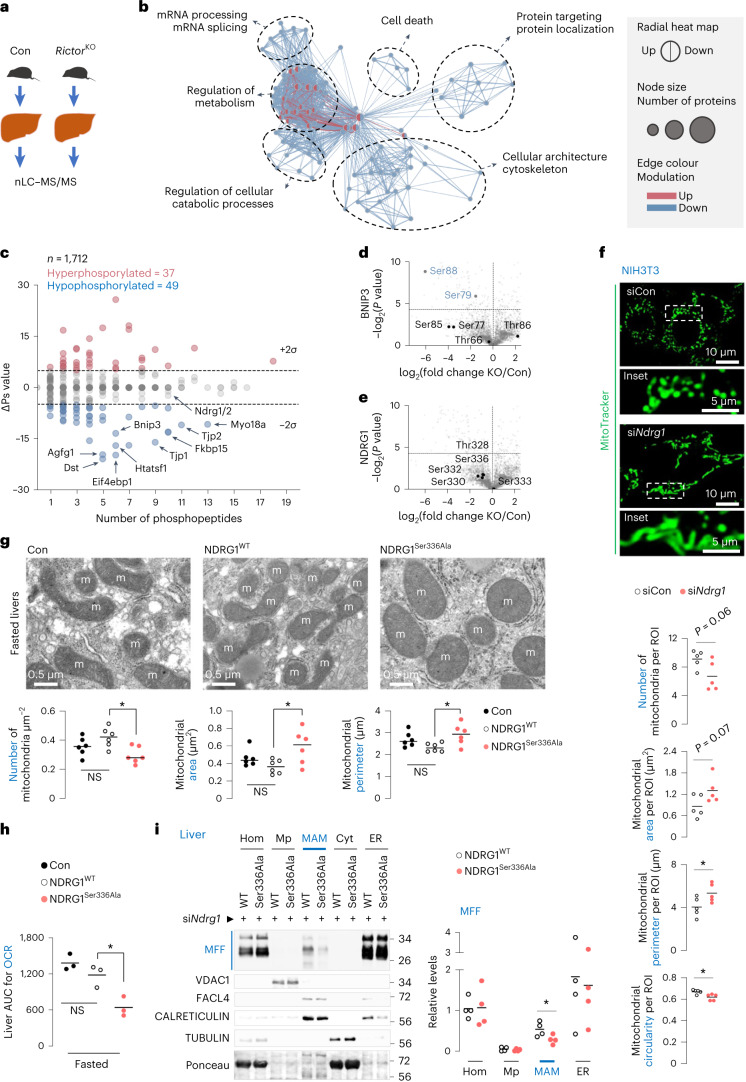
Fig. 4. mTORC2 signalling drives mitochondrial fission via NDRG1Ser336 phosphorylation.
a, Experimental plan for b–e. b, Enrichment map-based network visualization of Gene Ontology enrichment for differentially modulated phosphosites. Blue edges show similarity between decreased phosphosites, and red nodes show similarity between increased phosphosites. Node size indicates the number of proteins per node; major clusters are circled. Associated name represents the major functional association. c, Global ∆Ps analyses of phosphoproteins. Hyperphosphorylated and hypophosphorylated peptides in each comparison are shown. Labels indicate the genes encoding the proteins. Dotted lines: ∆Ps = ±2σ. d,e, Volcano plot for BNIP3 (d) or NDRG1 (e) phosphorylation in RictorKO versus Con livers fasted for 14–16 h. For a–e, n = 3 mice. f, Representative MitoTracker green fluorescence in serum-deprived siCon and siNdrg1 NIH3T3 cells (siCon 84 cells and siNdrg1 91 cells from n = 5 independent experiments). Quantifications for mitochondrial number and mitochondrial size/shape descriptors are shown. g–i, TEM with mitochondrial quantifications (n = 6 mice) (g), AUC for liver OCR (n = 3 mice) (h) and immunoblots and quantification (i) for indicated proteins in indicated fractions from livers of 3–4-month-old fasted (14–16 h) male mice expressing NDRG1WT or NDRG1Ser336Ala after silencing endogenous Ndrg1 by siRNAs (n = 4 mice). Ponceau is loading control. Individual replicates and means are shown. *P < 0.05, two-tailed unpaired Student’s t-test (c–f and i); one-way ANOVA followed by Tukey’s comparisons test (g and h). NS, not significant. Please refer to Supplementary Table 10 statistical summary, and Supplementary Tables 4 and 5. Source numerical data are available in Source Data for Extended Data Table 1, and unprocessed blots are available in the Source Data for this figure.

