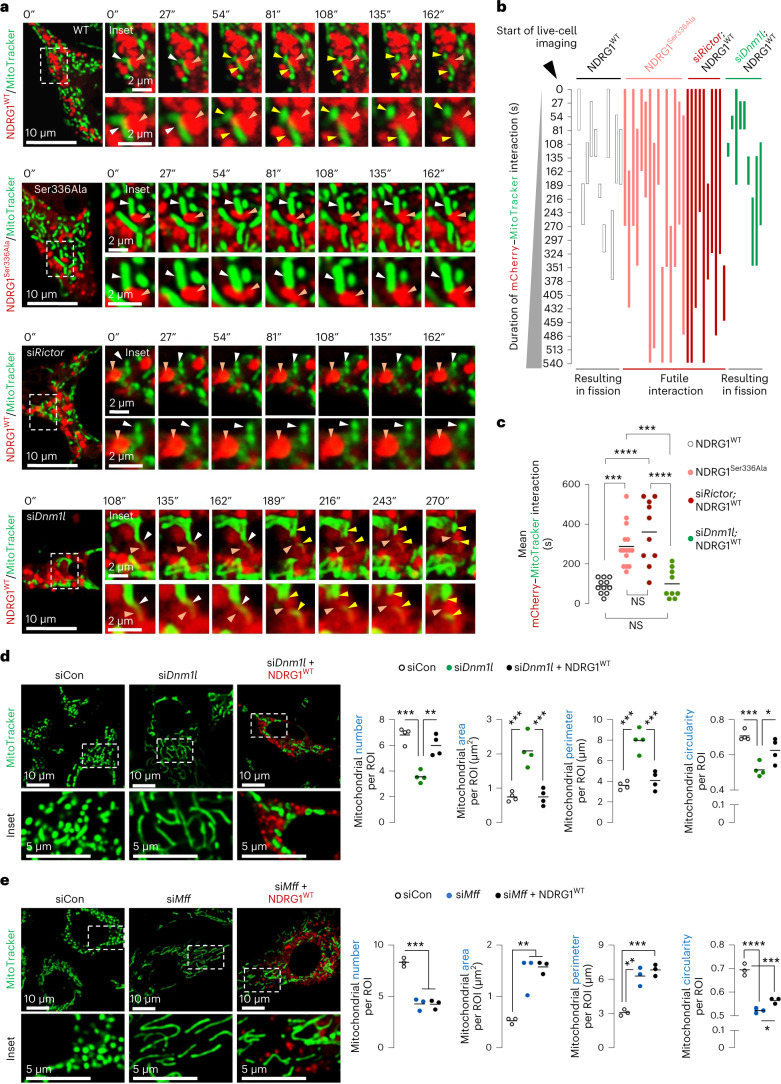
Fig. 5. Phosphorylated NDRG1Ser336 requires MFF, but not DRP1, for mitochondrial fission.
a, Live cell imaging of mCherry–NDRG1WT or mCherry–NDRG1Ser336Ala and MitoTracker green in siCon NIH3T3 cells or live cell imaging of mCherry–NDRG1WT and MitoTracker in siRictor or siDnm1l NIH3T3 cells cultured in serum-free medium for 30 min. Orange arrowheads: NDRG1 (mCherry). White arrowheads: mCherry/MitoTracker contact reflecting NDRG1/mitochondria contact before fission. Yellow arrowheads: divided mitochondria after scission by NDRG1 (mCherry). Magnified insets are shown. Please refer to Supplementary Video 6 (mCherry–NDRG1WT/MitoTracker), Supplementary Video 9 (mCherry–NDRG1Ser336Ala/MitoTracker), Supplementary Video 10 (siRictor; mCherry–NDRG1WT/MitoTracker) and Supplementary Video 11 (siDnm1l; mCherry–NDRG1WT/MitoTracker). b, Quantification for duration/fate (fission versus no fission) of interaction between NDRG1 (mCherry) and mitochondria (MitoTracker). Quantifications are also shown for duration of NDRG1 (mCherry)-mitochondrial (MitoTracker) interaction events and whether each interaction led to fission (useful) or not (futile) as recorded via live cell imaging. The X axis represents time in seconds—reflecting duration of contact of NDRG1 (mCherry) with mitochondria (MitoTracker). Each individual-coloured bar on the Y axis represents one interaction per individual cell. The length of each coloured bar represents the time from the initiation of interaction of NDRG1 (mCherry) with mitochondria (MitoTracker) till end of interaction. c, Quantification for mean duration of mCherry–NDRG1/mitochondria (MitoTracker) interaction is shown. For b and c (NDRG1WT 11 cells, NDRG1Ser336Ala 15 cells, siRictor/NDRG1WT 10 cells and siDnm1l/NDRG1WT 9 cells from n = 4 independent experiments; each tracked cell was monitored on an independent plate). d,e, Representative images of siDnm1l (n = 4 independent experiments) (d) or siMff (n = 3 independent experiments) (e) NIH3T3 cells expressing mCherry–NDRG1WT or not and cultured in serum-free medium for 30 min in presence of MitoTracker green. Magnified insets are shown. Quantifications for mitochondrial number and mitochondrial size/shape descriptors are shown. Individual replicates and means are shown. *P < 0.05, **P < 0.01, ***P < 0.001 and ****P < 0.0001, one-way ANOVA followed by Tukey’s multiple comparisons test. Please refer to Supplementary Table 10 statistical summary. Source numerical data are available in the Source Data to Extended Data Table 1.

