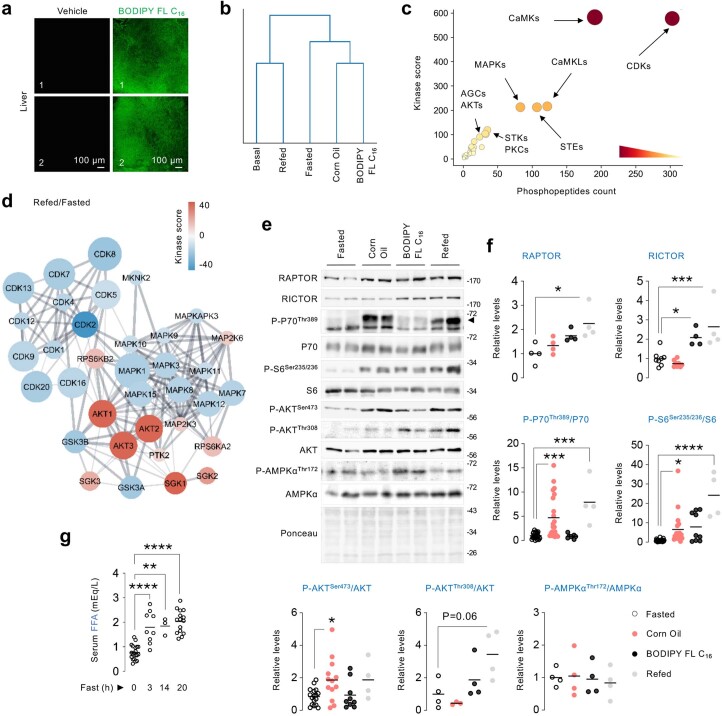
Extended Data Fig. 1. Kinases responsive to fasting or fatty acids.
(a) Direct BODIPY fluorescence in liver slices of 8 mo-old C57BL/6 male mice subjected to 30 min gavage with vehicle or 10 mg/kg of BODIPY FL C16 after 14–16 h fasting (n = 5 mice). (b) Dendrogram of hierarchical clustering analysis (Euclidean distance) between experimental groups based on phosphorylation status of 863 phosphosites. (c) Prediction for kinases that putatively target the phosphosites identified within the green cluster in main Fig. 1b. Darker color intensity reflects higher kinase score. (d) Pairwise comparisons showing upregulated (red) or downregulated (blue) kinase networks in mice refed high fat diet (HFD) for 30 min after 14–16 h fasting. For b-d (n = 4 mice). (e) Representative IB, and (f) quantification for the indicated proteins in livers of 2–8 mo-old C57BL/6 male or female mice kept fasted for 14–16 h or treated with corn oil or BODIPY FL C16 or refed a HFD for 30 min after fasting. N values for number of mice analyzed for individual proteins and conditions are indicated in parentheses. RAPTOR and P-AMPKThr172/AMPK: n = 4 per group; RICTOR: fasted (n = 8), corn oil (n = 8), BODIPY FL C16 (n = 4), refed (n = 4); P-P70Thr389/P70: fasted (n = 23), corn oil (n = 22), BODIPY FL C16 (n = 8), refed (n = 4); P-S6Ser235/236/S6 fasted (n = 23), corn oil (n = 24), BODIPY FL C16 (n = 9), refed (n = 4); P-AKTSer473/AKT: fasted (n = 17), corn oil (n = 13), BODIPY FL C16 (n = 9), refed (n = 4); P-AKTThr308/AKT: fasted (n = 4), corn oil (n = 3), BODIPY FL C16 (n = 4), refed (n = 4). Ponceau is the loading control. (g) Circulating free fatty acids (FFA) in 2–7 mo-old male mice fasted for: 0 h (n = 20 mice), 3 h (n = 9 mice), 14 h (n = 3 mice) or 20 h (n = 15 mice). Individual replicates and mean values are shown. *P < 0.05, ***P < 0.001 and ****P < 0.0001, One-way ANOVA followed by Šídák’s multiple comparisons test (f); One-way ANOVA followed by Tukey’s multiple comparisons test (g). Please refer to Supplementary Table 10_statistical summary, and Supplementary Tables 1, 2. Source numerical data are available in SourceData_Table 1, and unprocessed blots are available in Source Data Extended Data Fig. 1.

