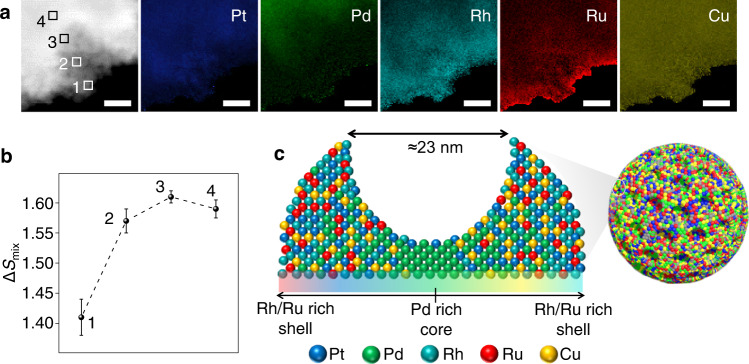
Fig. 2. Elemental distributions at one pore of PtPdRhRuCu MMNs.
a HAADF–STEM image and EDS maps at one edge pore of a PtPdRhRuCu MMN (scale bar: 10 nm). b Corresponding ΔSmix value at the selected area (i.e., 1, 2, 3, and 4) of (a). c Schematic of the elemental distribution around one mesopore of the PtPdRhRuCu MMN. Error bar in (b) correspond to the standard deviation based on the measurements at three points within the selected region. Source data are provided as a Source data file.

