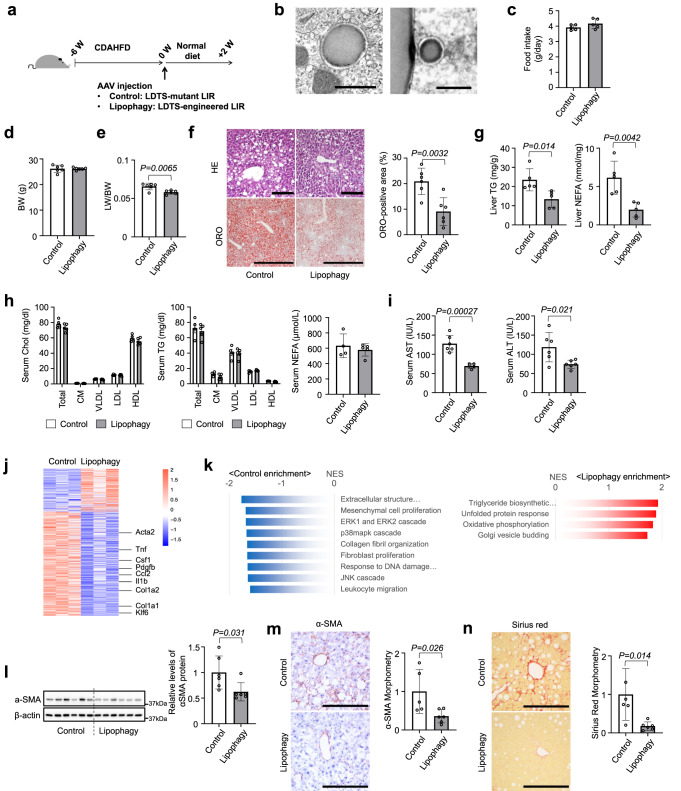
Fig. 2. Lipophagy improved nonalcoholic steatohepatitis in mice fed CDAHFD.
a Study protocol of NASH model with choline-deficient, L-amino acid-defined, high-fat diet (CDAHFD) and the induction of lipophagy with AAV-mediated gene delivery into hepatocytes. b Electron micrographs of lipophagy-induced liver tissues. Scale bars, 1 µm. c–e Food intake (c), body weight (d) and liver/body weight (LW/BW) ratios (e) of lipophagy-induced NASH model mice. f Hematoxylin/eosin or oil red O (ORO) staining of liver sections. Scale bars, 1 mm. g Liver TG and NEFA content. h Serum cholesterol and triglyceride (TG) in 4 major fractions and NEFA contents. i Serum AST and ALT levels. j, k RNA sequence and gene set enrichment analysis of liver tissues. l Immunoblots assessing the expression of αSMA in liver tissues. m, n Immunohistochemistry of αSMA (m) and sirius red staining (n) of liver sections and morphometry analysis of signal positive area. Scale bars, 200 µm. All data are presented as mean ± SD (n = 6 per group). P values calculated by two-sided unpaired t-test. Source data are provided as a Source data file.

