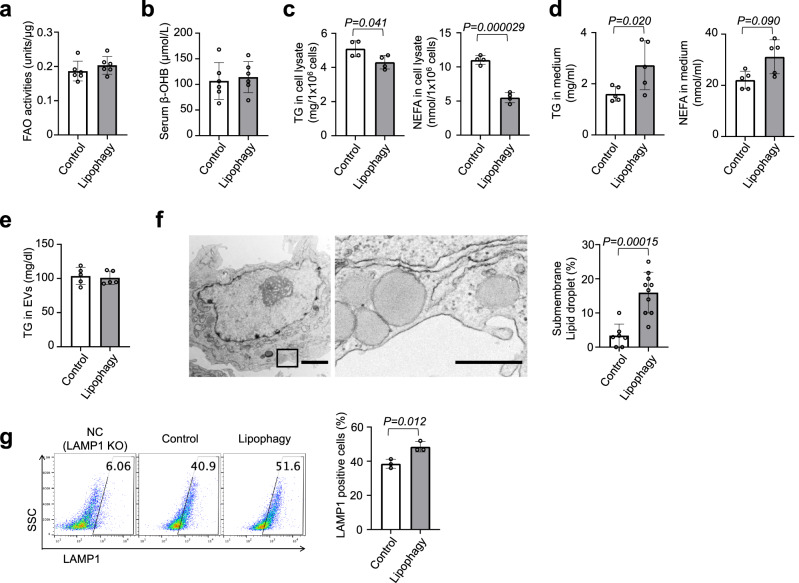
Fig. 4. Lipophagy excreted LDs through the lysosomal exocytosis.
a Fatty acid oxidation (FAO) activities of liver tissues in mice fed CDAHFD for the NASH model. b The levels of serum ß-OHB in mice fed CDAHFD (a, b; n = 6 per group). c, d HepG2 cells expressing LDTS-LIR mut (control) or eLIR (lipophagy) were cultured in medium containing oleic and palmitic acid (OA + PA) for 12 h and then incubated in FBS-free medium for 6 h. TG and NEFA of cell lysate (c) and culture supernatant (d) were measured (n = 4 per group). e TG content in serum exosomes in a mouse model of NASH fed with CDAHFD (n = 5 per group). f Electron micrographs of lipophagy-induced hepatocyte. Right image is magnified view of left black square. LDs localized close to cellular membrane was quantified. Scale bars, 2 µm and 500 nm (n = 10 cells per group). g Flow cytometry for Lamp1 in the surface of HepG2 cells expressing LDTS-LIR mut (control) or eLIR (lipophagy). LAMP1 KO cells were used as a negative control (n = 3 per group). All data are presented as mean ± SD. P values calculated by two-sided unpaired t-test. ß-OHB; ß-Hydroxybutyric acid. Source data are provided as a Source data file.

