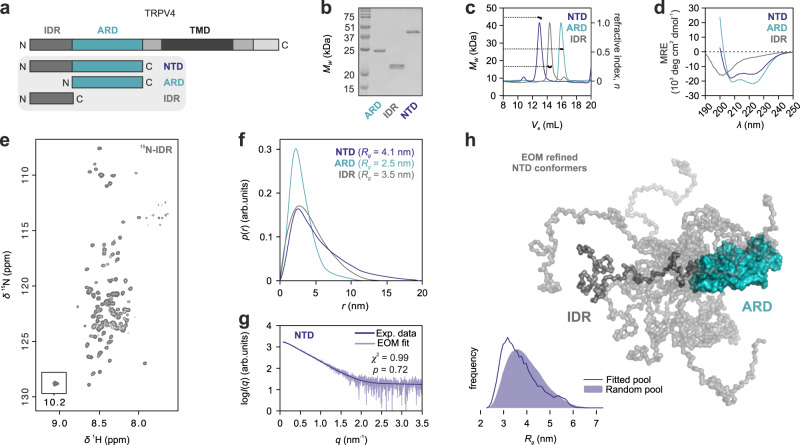
Fig. 1. Structural ensemble of the TRPV4 N-terminal domain.
a TRPV4 N-terminal constructs used for structural analyses. b–d Purified TRPV4 N-terminal constructs analyzed by Coomassie-stained SDS-PAGE b, SEC-MALS c, and CD spectroscopy d. SDS-PAGE in b comparing all constructs side by side was carried out once to evaluate sample purity and respective molecular weight. e [1H, 15N]-TROSY-HSQC NMR spectrum of 15N-labeled TRPV4-IDR (see Supplementary Fig. 2 for backbone assignments). f, g SAXS pair-distance-distribution f and SAXS EOM (Ensemble Optimization Method) g, both in arbitrary units (arb. units), of TRPV4 N-terminal constructs (Supplementary Fig. 3). The real-space distance distribution yields a radius of gyration of Rg = 3.4 nm with a maximal particle dimension of Dmax = 14.0 nm for the IDR, Rg = 4.1 nm and Dmax = 19 nm for the NTD as well as Rg = 2.5 nm and a Dmax = 11.5 nm for the ARD. Every protein exhibits levels of conformational heterogeneity and the p(r) profiles should be interpreted as the summed volume-fraction weighted contribution within the sample population, and not as single-particle distributions. The statistical analyses of the fit in g was carried out using the reduced χ2 method93 (one-tailed distribution) and CorMap64 (one-tail Schilling distribution) test methods. The determined χ2 and CorMap p values are indicated in the corresponding graph. h NTD ensemble refined by EOM (Ensemble Optimization Method)37,38. Using a chain of dummy residues for the IDR and the X-ray structure of the TRPV4 ARD (PDB: 3W9G) as templates, a library of 10,000 NTD structures was generated and refined against the experimental data, allowing the comparison of the fitted versus the random pool and selecting a sub-set of ensemble-states representing the experimental data. Ten IDR conformers best representing the experimental scattering profile are depicted. Source data are provided as a Source Data file.

