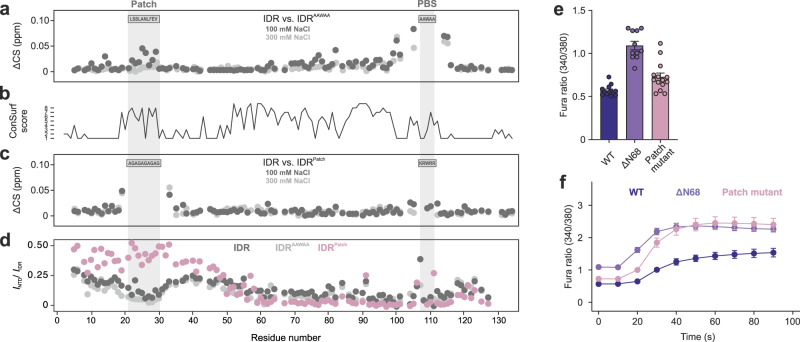
Fig. 6. A highly conserved patch in the N-terminal TRPV4 IDR transiently interacts with the C-terminal PIP2 binding site and autoinhibits TRPV4 function.
a Chemical shift differences at high and low salt between 15N-labeled native IDR and IDRAAWAA with a mutated PIP2 binding site (PBS) shows that mutagenesis of the PBS leads to chemical shift changes in the conserved N-terminal patch. At the higher salt concentration (light gray), these chemical shift perturbations are significantly reduced. b Degree of conservation in TRPV4 IDR determined with ConSurf50 (Supplementary Fig. 11). c Chemical shift differences at high and low salt between 15N-labeled IDR and IDRPatch with a mutation in the conserved N-terminal patch shows that mutagenesis leads to chemical shift changes in the PBS. At the higher salt concentration (light gray), these chemical shift perturbations are significantly reduced. d Relative peak intensity of IDR, IDRAAWAA and IDRPatch residues in the isolated IDR or in context of the ARD (i.e., NTD, NTDAAWAA or NTDPatch). All protein concentrations used were 100 µM. A value of 0.5 indicates that peak intensities for a respective IDR residue are halved when the ARD is present, a value of zero represents complete line broadening in the context of the NTD. Accordingly, lower values are indicative of IDR/ARD interactions. e, f Ca2+ imaging of hsTRPV4 variants expressed in MN-1 cells. e Basal Ca2+ and f hypotonic treatment at t = 20 s show increased activity of the patch mutant. For better comparison, data for TRPV4ΔN68 are replotted from Fig. 5h, i. Data in e are presented as mean values ± SEM from n = 13 (TRPV4), 11 (TRPV4ΔN68), 14 (TRPV4Patch) and in f from n = 12 (TRPV4, TRPV4ΔN68, and TRPV4Patch) biologically independent experiments, each with 10–30 cells per field of view. Source data are provided as a Source Data file.

