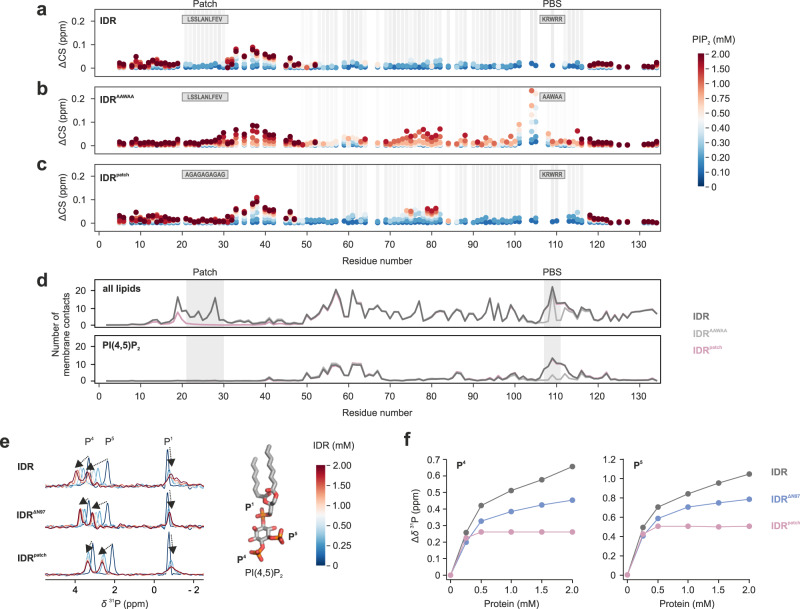
Fig. 8. The conserved N-terminal patch modulates lipid binding to the IDR.
a, b, c Chemical shift perturbation of 15N-labeled a IDR, b IDRAAWAA, and c IDRPatch titrated with short-chain PIP2. Mutated regions are indicated in gray boxes, chemical shift changes are depicted by colored spheres, residues showing line broadening are highlighted by gray bars. d Average number of membrane contacts for each residue of the native IDR (dark gray), the IDRAAWAA mutant (light gray) and the IDRPatch mutant (mauve) on a lipid bilayer composed of POPC (69%), CHOL (20%), DOPS (10%), PIP2 (1%) (Supplementary Table 4). The location of the N-terminal patch and the PIP2-binding site (PBS) are highlighted by gray boxes. In the upper panel, contacts for all lipids, in lower panel, only contacts with PIP2 are shown. Four replicate simulations per IDR sequence were carried out for 38 µs and contact averages were calculated from the last ~28 µs of each simulation. e 31P NMR spectra of diC8-PIP2 (light blue) with increasing amounts of IDR, IDRΔN97 or IDRPatch. Chemical shift changes are indicated by arrows. f Chemical shift perturbations of P4 and P5 lipid headgroup resonances upon addition of IDR (gray), IDRΔN97 (blue), or IDRPatch (mauve). Source data are provided as a Source Data file.

