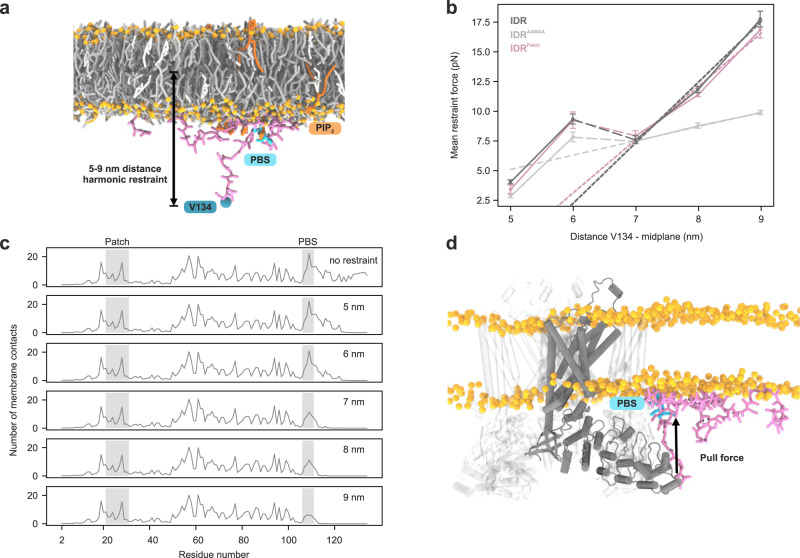
Fig. 9. PIP2 binding to the TRPV4 IDR’s PIP2-binding site exerts a pulling force on the ARD.
a Coarse-grained MD simulation system setup using a lipid bilayer membrane consisting of PIP2 (1%, dark orange) as well as POPC (69%, dark gray), DOPS (10%, light gray) and cholesterol (20%, white). Headgroup phosphates are shown as orange spheres), the IDR (pink liquorice) was kept at defined distances from the membrane midplane by its most C-terminal residue V134 (blue sphere) to emulate anchoring by the ARD. The PIP2-binding site (PBS) is highlighted in cyan. b Force displacement curves from restrained simulations of TRPV4 IDR, IDRAAWAA and IDRPatch. Four 38 µs replicate simulations were carried out for each condition. The mean restraint force is plotted against the mean distance between residue V134 and the membrane midplane. Dotted lines show linear fits of the force contribution of the PIP2-binding site. Averages were calculated from the last ~28 µs of each of the 4 replicate simulations per IDR genotype and per height restraint. Error bars show the standard errors of the mean (SEM) of the replicate simulations. c Number of membrane lipid contacts for each residue of the native IDR at a given height restraint (for results with IDRAAWAA and IDRPatch, see Supplementary Fig. 10c). Averages are calculated from the last 28 µs of each of the four replicate simulations. d Composite figure of a structure of the native IDR (from an MD simulation at a restraint distance of 7 nm) and an AlphaFold94 model of the transmembrane core of the G. gallus TRPV4 tetramer. The force displacement curves in b indicate that the interaction of the PIP2-binding site with the membrane exerts a pull force on the ARD N-terminus (solid arrow). Source data are provided as a Source Data file.

