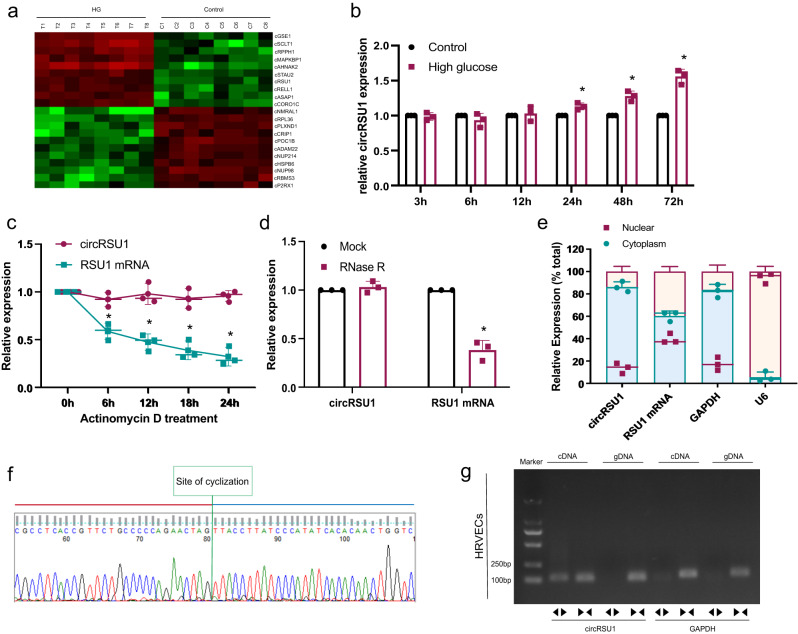
Fig. 1. circRSU1-expression pattern in HRVECs.
a Analysis of the significant circRNAs expression clustering of basal HRVECs and high-glucose HRVECs. b circRSU1 expression in HRVECs for a period (3, 6, 12, 24, 48 and 72 h). c The amount of circRUS1 and RSU1 mRNA in HRVECs after actinomycin D treatment. d After RNase R digestion, qRT-PCR assay was conducted to detect circRSU1-expression level. RSU1 mRNA level was measured as control. e circRSU1, RSU1 mRNA, GAPDH (cytoplasm control) and U6 (nuclear control) expression levels were analyzed by qRT-PCR. f The sequence obtained from Sanger sequencing matched the sequence of circRSU1 listed in circBase. g PCR analysis revealed the presence of circRSU1 through backsplicing. Using divergent primers, circRSU1 was successfully amplified in cDNA samples while showing no amplification in gDNA samples. A negative control with GAPDH was utilized. Unpaired student’s t-test, two-way ANOVA test, and Bonferroni test were used for the statistical analyses. *p < 0.05.

