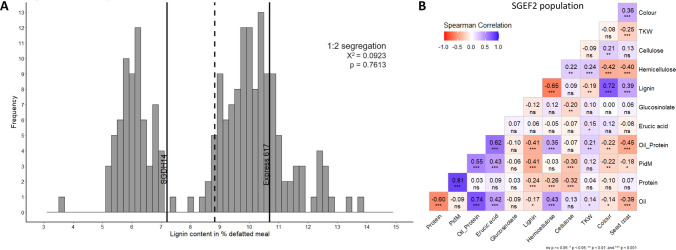
Fig. 1.
Phenotypic characterisation of the SGEF2 population. A Frequency distribution of lignin content in defatted meal of the SGEF2 population (F2:3 seeds). The lignin content of the parental genotypes SGDH14 and Express 617 is indicated by black vertical lines and the grey vertical dashed line marks the mean lignin content of the SGEF2 population (n = 195). The Chi-square result for a 1:2 segregation is displayed. The p-value is not significant so that H0, the 1:2 segregation, is accepted. B Correlation Matrix of the SGEF2 population (F2:3 seeds). Positive correlation is indicated in blue and negative correlation is indicated in red. The correlation coefficients are given for each trait. PidM is protein content in the defatted meal at 91% dry matter (color figure online)

