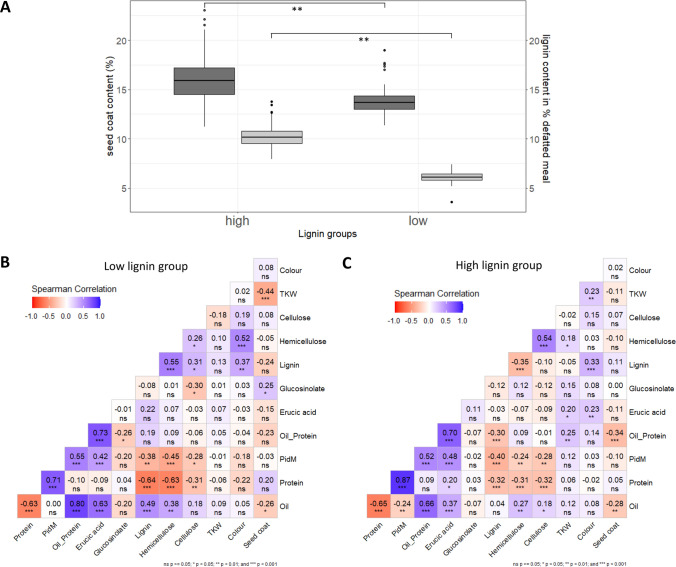
Fig. 2.
Phenotypic characterisation of the high and low lignin groups of the SGEF2 population. A Seed coat and lignin content (%) in high and low lignin groups of the SGEF2 population. The high lignin group (n = 128) is shown on the left and the low lignin group (n = 67) is displayed on the right side of the figure. Dark grey coloured boxplots represent the seed coat content and the light grey boxplots show the lignin content. The significance level was calculated with a single-factor ANOVA. ** Shows significance p < 0.01. B Correlation Matrix of the low lignin group of the SGEF2 population (F2:3 seeds). Positive correlation is indicated in red and negative correlation is indicated in blue. The correlation coefficients are given for each trait. PidM is protein content in the defatted meal at 91% dry matter. C Correlation Matrix of the high lignin group of the SGEF2 population (F2:3 seeds). Positive correlation is indicated in blue and negative correlation is indicated in red. The correlation coefficients are given for each trait. PidM is protein content in the defatted meal at 91% dry matter (color figure online)

