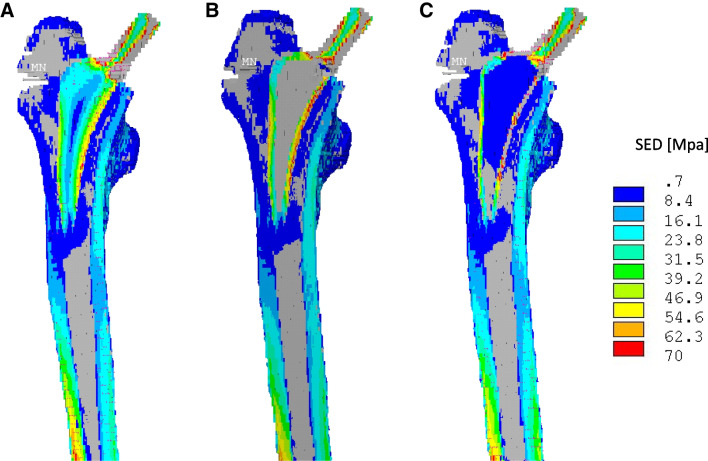
Fig. 3.
SED-Changes after virtual implantation of a Fitmore® stem [MPa]. The figure shows the distribution of strain energy in the femoral bone under force application. Reduction of the stress shielding shown by higher values is predominantly present in the medial regions. Force absorption by the stem decreases as the metal shell becomes thinner. A full-bodied original stem, B double-layer stem with a 1.32-mm big shell, and double-layer stem with a 0.66-mm small shell (C). Graphics were taken from Ansys®

