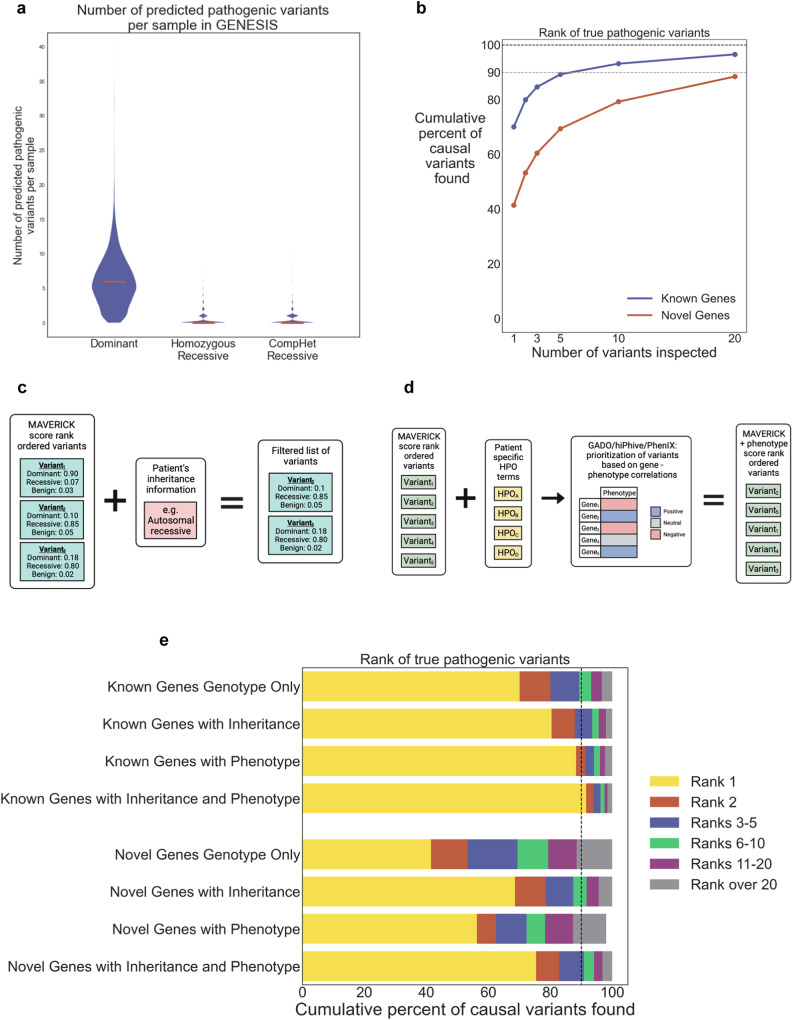
Fig. 3. MAVERICK reliably prioritizes causal variants in simulated cases.
a Violin plots of the distribution of variants predicted as pathogenic by MAVERICK among 10,138 individuals in the GENESIS database. The median of each distribution is denoted by a horizontal red line. A value of 0.5 was used as the threshold for being ‘pathogenic’ in this analysis. So, heterozygous variants with a dominant MAVERICK score over 0.5 are shown on the left, homozygous variants with a recessive MAVERICK score over 0.5 are shown in the center, and pairs of heterozygous variants on the same gene with a harmonic mean of recessive MAVERICK scores over 0.5 are shown on the right. b Scatterplot of cumulative proportion of cases solved by MAVERICK’s rank ordering of variants using genotype information only when 98 control samples had pathogenic variants from the known and novel genes test sets spiked in. 13,095 pathogenic variants from the known genes set and 696 pathogenic variants from the novel genes set were used. Testing each of these variants in each of the 98 control samples produced 1,351,518 simulated cases. c Diagram of how MAVERICK filters variants based on user-provided inheritance information. d Diagram of how MAVERICK leverages phenotype information using the GADO, HiPhive, or PhenIX algorithms to adjust its predictions. e Stacked horizontal bar plots showing how performance on both the known and novel genes test sets improves when additionally incorporating inheritance and/or phenotypic information along with MAVERICK variant prediction scores.

